
Data Center Switch Market Size, Share & Forecast to 2035
Market at a glance
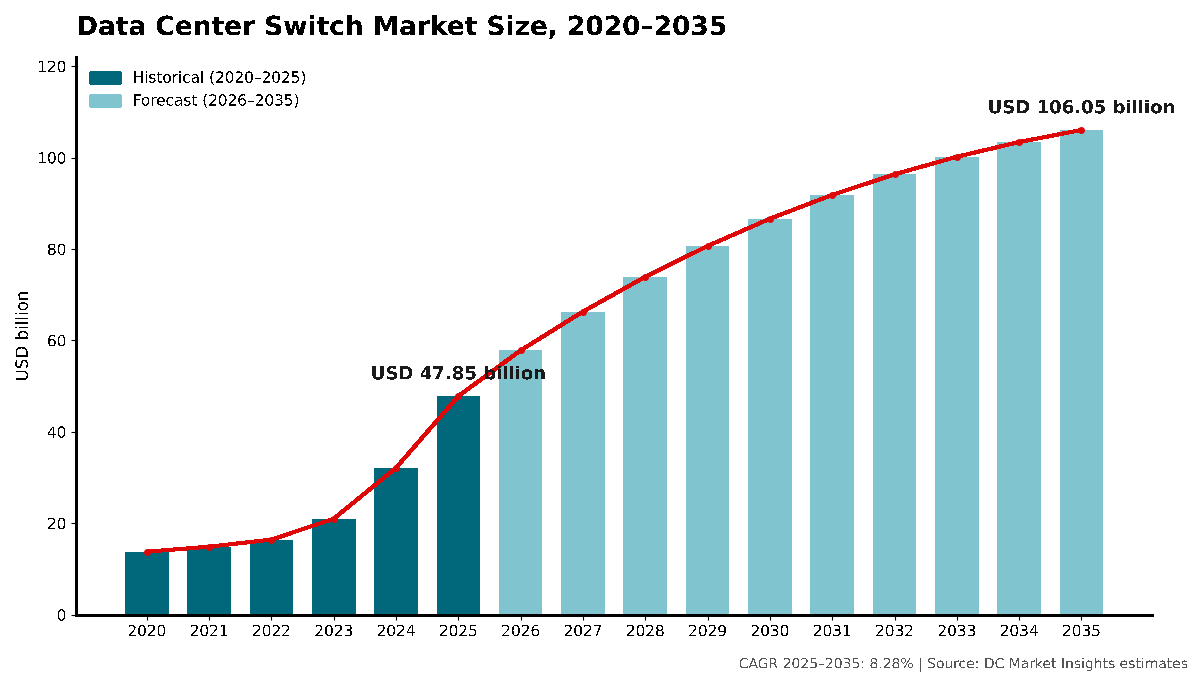
The Data Center Switch market was worth USD 47.85 billion in 2025 and is forecast to reach USD 106.05 billion by 2035, growing at a 8.28% CAGR. North America accounts for 46.8% of the market.
 By Amit Jain, Senior Consultant, ICT & Emerging Technologies
 Reviewed by Deepti Agrawal
Last updated 7 Oct 2026
Base year 2025 PDF + Excel
Reviewed by Deepti Agrawal
Last updated 7 Oct 2026
Base year 2025 PDF + Excel
Source: DC Market Insights analysis
Key findings
AI Back-End Fabrics Took 41.3% of Switch Spend in 2025
Switch Chips Double to 102.4 Tbps
Two Customers Bought 42% of Arista's 2025 Sales
1.6T Ports Grow from USD 1.67 billion to USD 54.12 billion
What is inside the report
- 01Introduction
- 02Research Methodology
- 03Executive Summary
- 04Market Dynamics
- 05Pricing Analysis
- 06Standards and Regulation
- 07Supply Chain and Value Chain
- 08Market Size and Forecast
- 09Market by Switch Type
- 10Market by Network Role
- 23chapters
- 2020-2024Historical period
- 2026-2035Forecast period
- 17Companies profiled
Regional insights
- North America46.8%
- Asia Pacific28.6%
- Europe14.9%
- Middle East and Africa5.6%
- Latin America4%
Segmentation
Companies profiled
- NVIDIA
- Arista Networks
- Cisco Systems
- Huawei
- Hewlett Packard Enterprise (Juniper Networks)
- Celestica
- Accton Technology
- H3C
- Dell Technologies
- Ruijie Networks
- ZTE
- Nokia
- Broadcom
- Extreme Networks
- Supermicro
- Lenovo
- NEC
Recent developments
Broadcom began shipping Tomahawk 6, the first switch series with 102.4 terabits per second of switching capacity in a single chip (Source: Broadcom press release).
Hewlett Packard Enterprise completed its acquisition of Juniper Networks, doubling the size of its networking business (Source: HPE press release).
Broadcom began shipping the Jericho4 Ethernet fabric router, designed to interconnect over one million XPUs across multiple data centers (Source: Broadcom press release).
the Open Compute Project launched the Ethernet for Scale-Up Networking (ESUN) workstream (Source: OCP announcement).
Cisco announced the Silicon One G300, a 102.4 Tbps switching chip, with G300-based systems shipping in 2026 (Source: Cisco press release).
Full analysis
The Data Center Switch Market covers the Ethernet, InfiniBand and AI scale-up fabric switches that connect servers, accelerators and storage inside data center buildings and campuses, from top-of-rack leaf switches to spine, AI back-end and in-rack scale-up switch trays. DC Market Insights values the global Data Center Switch Market at USD 47.85 billion in 2025 and forecasts USD 106.05 billion by 2035, a CAGR of 8.28%. The 2025 value is built port by port: about 47.37 million Ethernet switch ports at a blended USD 691 per port give USD 32.72 billion, about 6.68 million InfiniBand ports at roughly USD 1,210 per port add USD 8.08 billion, and scale-up switch content of about USD 1,090 per accelerator across 6.46 million rack-scale accelerators adds USD 7.04 billion. ODM and white-box suppliers are the fastest-growing segment by vendor model at 11.81% a year because hyperscalers increasingly design their own switches and buy them from contract manufacturers, and Latin America is the fastest-growing region at 10.24% a year as cloud and AI capacity spreads from a small base.
Executive Summary
The Global Data Center Switch Market size was valued at USD 13.80 billion in 2020, reached USD 47.85 billion in 2025, and is anticipated to reach USD 106.05 billion by 2035, at a CAGR of 8.28% during the forecast period.
| Report attribute | Details |
|---|---|
| Historical Period | 2020-2024 |
| Base Year | 2025 |
| Forecast Period | 2026-2035 |
| Data Center Switch Market Size 2025 | USD 47.85 Billion |
| Data Center Switch Market, CAGR | 8.28% |
| Data Center Switch Market Size 2035 | USD 106.05 Billion |
DC Market Insights estimates that the market grew at 28.23% a year between 2020 and 2025, and that 2025 alone added 48.8% over 2024 as graphics processing unit (GPU) clusters moved from single halls to campus-scale fabrics with their own back-end and scale-up switch layers. Switches made up 62.1% of all data center networking spend in 2025 by DC Market Insights estimates, against 43.1% in 2020, because an AI cluster needs two or three switch tiers that a general-purpose hall never had. Vendor results point the same way: Arista Networks reported 2025 revenue of USD 9.006 billion, up 28.6% (Source: Arista Networks earnings release filed with the US Securities and Exchange Commission), and NVIDIA reported record networking revenue of USD 11.0 billion in the fourth quarter of its fiscal 2026, up 263% from a year earlier (Source: NVIDIA CFO commentary).
DC Market Insights forecasts growth of 20.9% in 2026, to USD 57.84 billion, then a gradual slowdown to 8.28% a year over the decade. Growth slows because each switch chip generation doubles bandwidth per device, so the price of a port falls even as the number of ports per cluster rises.
Market Scope: What Does the Data Center Switch Market Cover?
The Data Center Switch Market covers every switch system bought to connect compute, accelerators and storage inside data center buildings and campuses, valued at first sale in current US dollars, with 2025 as the base year and forecasts to 2035. DC Market Insights sizes it at USD 47.85 billion in 2025.
Included. Ethernet data center switches at every layer (access and top-of-rack leaf, aggregation and distribution spine, core and super-spine, and AI back-end switches, in fixed-configuration and modular chassis form), InfiniBand switches, scale-up fabric switches and switch trays that join accelerators inside a rack or pod, the network operating system licenses sold with the switch, and switches sold as branded systems, as accelerator platform components or as white-box hardware from original design manufacturers (ODMs).
Excluded. Routers, including data center interconnect and edge routers, network interface cards (NICs), SmartNICs and data processing units (DPUs), pluggable optical transceivers and co-packaged optical engines sold as separate items, copper and fiber cables, standalone network software subscriptions and services, and campus, branch and Wi-Fi switches outside the data center. Optical modules are sized in the Optical Transceiver Market report.
Fibre Channel switches. Fibre Channel (fiber channel) storage area network (SAN) switches are also excluded. They carry block-storage traffic between servers and storage arrays on their own protocol and speed generations, are bought with storage systems rather than with the compute fabric, and are not part of the switch-type split. Storage traffic that runs over Ethernet is counted in the Storage and Management Networks role, which holds 9.0% of 2025 value in DC Market Insights estimates.
How the segments fit together. The switch-type, network-role, switch-layer, switch-design, vendor-model and end-user splits each divide the full USD 47.85 billion. The scale-up fabric switch type, the AI scale-up network role, the in-rack scale-up layer and the scale-up switch tray design describe the same USD 7.04 billion of products from four angles. The port-speed split covers only Ethernet switches, with a 2025 value of USD 32.72 billion. The Data Center Switch Market is the switching subset of the wider Data Center Networking Market, and its switch-type figures match that report.
Market Drivers: What Drives the Data Center Switch Market?
AI back-end fabrics, with 41.3% of 2025 switch spend, explain most of the growth in the Data Center Switch Market, followed by in-rack scale-up switching and a construction pipeline of more than 23 GW.
AI Back-End Fabrics Took 41.3% of Switch Spend in 2025
A GPU training or inference cluster joins thousands of accelerators into one back-end fabric, usually with two or three switch tiers and one switch port for every accelerator network port. In DC Market Insights estimates, the AI back-end scale-out fabric takes 41.3% of 2025 switch spend and grows 9.03% a year through 2035, faster than the 8.28% of the whole market. Vendor order books point the same way: Cisco took USD 9.3 billion of AI infrastructure orders from hyperscalers in fiscal 2026, including USD 4 billion in the fourth quarter, and expects about USD 7.5 billion of AI infrastructure revenue in fiscal 2027, up from about USD 4 billion in fiscal 2026.
Scale-Up Switching Adds USD 7.04 billion Inside the Rack
Accelerator systems built at rack scale add a switched memory-semantic fabric inside the rack that conventional servers never needed. NVIDIA attributed its networking growth to the NVLink compute fabric for GB200 and GB300 systems and to the growth of its Ethernet and InfiniBand platforms. DC Market Insights estimates scale-up switch content at about USD 1,090 per accelerator in 2025 and forecasts scale-up fabric switches to grow from USD 7.04 billion to USD 17.33 billion by 2035, a CAGR of 9.43%, as open alternatives join proprietary fabrics.
More Than 23 GW of Capacity Under Construction
Switch demand follows the construction pipeline. BloombergNEF counted 23.1 GW of data center capacity under construction across 831 sites at the end of September 2025, 15.9 GW of it in the United States (Source: BloombergNEF data center construction analysis). DC Market Insights models switch spend rising from USD 47.85 billion in 2025 to USD 86.64 billion in 2030, as each new AI hall is fitted with front-end, back-end and scale-up switching before it goes live. AI back-end and scale-up switching together had a 2025 value of USD 26.82 billion, about USD 4.97 million for every MW of the 5.4 GW of accelerated IT load commissioned that year in the DC Market Insights networking model.
Market Trends: How Are Data Center Switches Changing?
The Data Center Switch Market is moving to 102.4 Tbps switch chips, to 1.6T ports that DC Market Insights expects to reach 66.8% of Ethernet switch value by 2035, and to optics that sit beside the switch chip.
Switch Chips Double to 102.4 Tbps
Broadcom began shipping Tomahawk 6 in June 2025, the first switch series with 102.4 terabits per second of switching capacity in a single chip, and said in March 2026 that the family was shipping in production volume. Cisco announced its own 102.4 Tbps Silicon One G300 in February 2026, with G300-based systems due to ship during 2026 (Source: Cisco Silicon One G300 announcement). Each doubling can roughly halve the switches needed for a given cluster.
Co-Packaged Optics Move into Production Switches
Co-packaged optics place the optical engine next to the switch chip and remove the pluggable module from the faceplate. NVIDIA announced Spectrum-X Photonics and Quantum-X Photonics switches in March 2025, claiming 3.5 times more power efficiency, said in May 2026 that Spectrum-X Ethernet Photonics was in production, and said in August 2026 that its Spectrum-6 switch systems, which support both pluggable and co-packaged optics, are arriving at gigascale AI factories. Co-packaged optics shift value from separately sold transceivers into the switch, which lifts switch value per port; DC Market Insights estimates count optical engines in switch value only when they ship inside the switch.
Hyperscalers Shift Toward ODM and White-Box Switches
Large cloud operators design their own switches and have them built by contract manufacturers. Celestica reported fourth-quarter 2025 Hardware Platform Solutions revenue of about USD 1.4 billion, up 72%, and won a program to design and manufacture a 1.6 terabyte switching platform for a third hyperscale customer, with production expected to ramp in 2027. DC Market Insights estimates that ODM and white-box switches grow from USD 8.70 billion (18.2%) in 2025 to USD 26.59 billion (25.1%) by 2035.
Market Challenges: What Holds the Data Center Switch Market Back?
Customer concentration and falling InfiniBand demand are the two constraints that DC Market Insights expects to shape the Data Center Switch Market through 2030, with hyperscale cloud providers holding 52.1% of 2025 spend.
Two Customers Bought 42% of Arista’s 2025 Sales
Arista’s annual report shows that two customers accounted for 26% and 16% of its 2025 revenue. Hyperscale cloud providers spend USD 24.95 billion on data center switches in 2025 by DC Market Insights estimates, so a pause in two or three capital spending plans moves the whole Data Center Switch Market.
InfiniBand Switch Sales Slip 0.48% a Year
Ethernet is taking a growing share of AI back-end fabrics as Ultra Ethernet and vendor-specific Ethernet fabrics close the latency and congestion-control gap. DC Market Insights forecasts InfiniBand switch sales to slip from a 2025 value of USD 8.08 billion to a 2035 value of USD 7.70 billion, a CAGR of -0.48%, while Ethernet switches grow at 9.49%.
Market Opportunities: Where Are the New Revenue Pools in Data Center Switching?
DC Market Insights identifies the two largest new revenue pools in the Data Center Switch Market as 1.6T and faster Ethernet ports, which reach USD 54.12 billion by 2035, and GPU and neocloud providers, growing at 9.66% a year.
1.6T Ports Grow from USD 1.67 billion to USD 54.12 billion
1.6T and faster ports had a 2025 value of USD 1.67 billion, about 0.63 million ports at roughly USD 2,650 each by DC Market Insights estimates, and grow at 41.61% a year as 200 Gb/s-per-lane signaling becomes the default for AI fabrics. Celestica’s 1.6T switching program for a third hyperscaler is due to ramp in 2027.
GPU and Neocloud Providers Reach USD 16.67 billion by 2035
DC Market Insights estimates that specialist GPU cloud operators spent USD 6.63 billion on data center switches in 2025 and expects their spend to reach a 2035 value of USD 16.67 billion. Their 41.9% InfiniBand mix also makes them the largest pool for Ethernet migration.
Pricing: How Much Does a Data Center Switch Port Cost?
A data center Ethernet switch port cost a blended USD 691 in 2025, from about USD 245 for a 100G-and-below port to about USD 2,650 for a 1.6T port. These are DC Market Insights estimates of the system price per port at first sale, including the network operating system license and excluding optics and cables.
| Port class, 2025 | Price per port (USD) | Ports shipped (million) | Value (USD billion) |
|---|---|---|---|
| 100G and Below | 245 | 24.58 | 6.02 |
| 200G and 400G | 910 | 13.63 | 12.40 |
| 800G | 1,480 | 8.53 | 12.63 |
| 1.6T and Above | 2,650 | 0.63 | 1.67 |
| InfiniBand (all speeds) | 1,210 | 6.68 | 8.08 |
Price per port rises with speed, but price per gigabit falls: a 1.6T port carries 16 times the bandwidth of a 100G port at about 10.8 times the price. Scale-up switching is priced per accelerator rather than per port, at about USD 1,090 per accelerator in 2025.
Standards and Regulation: Which Rules Shape Data Center Switches?
Five sets of standards and rules decide what data center switches look like: Institute of Electrical and Electronics Engineers (IEEE) Ethernet standards, the Ultra Ethernet Consortium (UEC) specification, two scale-up fabric specifications and national supply-chain rules.
IEEE P802.3dj. The IEEE P802.3dj task force is defining 200 Gb/s, 400 Gb/s, 800 Gb/s and 1.6 Tb/s Ethernet, the physical layers that the 1.6T switch generation depends on.
UEC Specification 1.0 (June 2025). The Ultra Ethernet Consortium released an Ethernet-based communication stack engineered for AI and high-performance computing (HPC) workloads, which gives switch vendors a common target for AI back-end fabrics, where DC Market Insights estimates 41.3% of 2025 switch spend sits.
UALink 200G 1.0 (April 2025) and OCP ESUN. The Ultra Accelerator Link (UALink) 200G 1.0 Specification enables 200G-per-lane scale-up connections for up to 1,024 accelerators in a pod. The Open Compute Project (OCP) launched the Ethernet for Scale-Up Networking (ESUN) workstream in October 2025 and released its first specification in March 2026, replacing the 28 to 48 byte IP/UDP header stack with a compact 4-byte header. Both open the scale-up switch layer to more suppliers, a layer DC Market Insights estimates at 14.7% of 2025 switch value, rising to 16.3% by 2035.
Supply-chain rules. The US Federal Communications Commission (FCC) Covered List includes telecommunications equipment produced by Huawei and ZTE. DC Market Insights treats this as one reason Chinese and Western switch supply chains are separating.
Market Segmentation: Which Segment Leads the Data Center Switch Market?
DC Market Insights estimates that Ethernet switches lead the Data Center Switch Market with 68.4% of 2025 value, AI back-end scale-out fabrics lead network roles with 41.3%, access and top-of-rack switches lead switch layers with 44.9%, fixed-configuration switches lead designs with 61.2%, branded network OEMs lead vendor models with 43.8% and hyperscale cloud providers lead buyers with 52.1%. Outside the port-speed split, ODM and white-box suppliers are the fastest-growing segment at 11.81% a year, because hyperscalers buy their own switch designs directly from contract manufacturers as fabrics standardize on Ethernet.
By Switch Type: Ethernet Leads with 68.4%
| Switch type | 2025 (USD billion) | Share 2025 | 2035 (USD billion) | CAGR 2025-2035 |
|---|---|---|---|---|
| Ethernet Switches | 32.72 | 68.4% | 81.02 | 9.49% |
| InfiniBand Switches | 8.08 | 16.9% | 7.70 | -0.48% |
| Scale-Up Fabric Switches | 7.04 | 14.7% | 17.33 | 9.43% |
Ethernet switches gain 8.0 points of share by 2035 as Ethernet takes most new AI back-end fabrics. Scale-up fabric switches hold their share, growing at 9.43%, while InfiniBand falls to 7.3% of the market.
By Network Role: AI Back-End Scale-Out Fabric Leads with 41.3%
| Network role | 2025 (USD billion) | Share 2025 | 2035 (USD billion) | CAGR 2025-2035 |
|---|---|---|---|---|
| AI Back-End Scale-Out Fabric | 19.78 | 41.3% | 46.96 | 9.03% |
| Front-End Leaf and Spine | 16.71 | 34.9% | 31.84 | 6.66% |
| AI Scale-Up Fabric | 7.04 | 14.7% | 17.33 | 9.43% |
| Storage and Management Networks | 4.32 | 9.0% | 9.93 | 8.69% |
Front-end leaf and spine switching, which links servers to users and storage, grows slowest at 6.66% because general-purpose halls refresh on long cycles. Storage and management networks grow at 8.69% as AI clusters add dedicated storage fabrics.
By Switch Layer: Access and Top-of-Rack Leads with 44.9%
| Switch layer | 2025 (USD billion) | Share 2025 | 2035 (USD billion) | CAGR 2025-2035 |
|---|---|---|---|---|
| Access and Top-of-Rack | 21.50 | 44.9% | 45.92 | 7.89% |
| Aggregation and Distribution | 12.49 | 26.1% | 28.65 | 8.65% |
| Core and Super-Spine | 6.82 | 14.3% | 14.15 | 7.57% |
| In-Rack Scale-Up | 7.04 | 14.7% | 17.33 | 9.43% |
Access switches, the top-of-rack and leaf tier that every server or accelerator plugs into, carry the most ports and the largest share of any layer. Aggregation and distribution switches, the spine tier, grow fastest of the three Ethernet and InfiniBand layers at 8.65% a year because AI back-end fabrics add spine stages, while core switches and super-spines grow slowest at 7.57% as 102.4 Tbps chips flatten many networks to two tiers. The layer split cuts across network roles, since front-end and AI back-end fabrics each have their own access, aggregation and core tiers. DC Market Insights allocates layers from port counts per tier in typical leaf-spine and three-tier designs.
By Switch Design: Fixed-Configuration Switches Lead with 61.2%
Fixed-configuration switches, the one- and two-rack-unit boxes used for leaf, top-of-rack and most AI back-end tiers, have a 2025 value of USD 29.27 billion and grow at 8.92% a year to USD 68.79 billion. Modular chassis switches are worth USD 11.54 billion (24.1%) and grow at 5.62%, slower because 102.4 Tbps single-chip switches can replace many spine chassis. Scale-up switch trays are worth USD 7.04 billion (14.7%).
By Vendor Model: Branded Network OEMs Lead with 43.8%
| Vendor model | 2025 (USD billion) | Share 2025 | 2035 (USD billion) | CAGR 2025-2035 |
|---|---|---|---|---|
| Accelerator Platform Vendors | 18.20 | 38.0% | 35.11 | 6.79% |
| Branded Network OEMs | 20.94 | 43.8% | 44.35 | 7.79% |
| ODM and White-Box Suppliers | 8.70 | 18.2% | 26.59 | 11.81% |
Accelerator platform vendors sell switches as part of a complete compute and networking platform and hold 38.0% of 2025 value. ODM and white-box suppliers gain 6.9 points of share by 2035.
By End-user: Hyperscale Cloud Providers Lead with 52.1%
| End-user | 2025 (USD billion) | Share 2025 | 2035 (USD billion) | CAGR 2025-2035 |
|---|---|---|---|---|
| Hyperscale Cloud Providers | 24.95 | 52.1% | 56.61 | 8.54% |
| GPU and Neocloud Providers | 6.63 | 13.9% | 16.67 | 9.66% |
| Enterprises | 7.16 | 15.0% | 12.19 | 5.46% |
| Government and Research | 5.08 | 10.6% | 11.58 | 8.59% |
| Telecom Service Providers | 4.02 | 8.4% | 9.00 | 8.39% |
GPU and neocloud providers grow fastest at 9.66%. Enterprises grow slowest at 5.46% as more workloads move to cloud and colocation, where the operator rather than the tenant buys the switches.
By Ethernet Port Speed: 1.6T and Above Grows Fastest at 41.61%
| Port speed (Ethernet switches) | 2025 (USD billion) | Share 2025 | 2035 (USD billion) | CAGR 2025-2035 |
|---|---|---|---|---|
| 100G and Below | 6.02 | 18.4% | 1.70 | -11.87% |
| 200G and 400G | 12.40 | 37.9% | 5.51 | -7.79% |
| 800G | 12.63 | 38.6% | 19.69 | 4.54% |
| 1.6T and Above | 1.67 | 5.1% | 54.12 | 41.61% |
800G ports are the largest speed class in 2025 at 38.6% of Ethernet switch value. DC Market Insights forecasts 1.6T and above to reach 66.8% by 2035, while ports at 100G and below shrink by 11.87% a year.
DC Exclusive: The Switch Port Model and Switch Type × Buyer Matrix
With a 2025 value of USD 16.52 billion, the Ethernet switches of hyperscale cloud providers form the single largest cell of the matrix and 34.5% of all data center switch spend.
| 2025, USD billion | Hyperscale | GPU and Neocloud | Enterprise | Government and Research | Telecom | Total |
|---|---|---|---|---|---|---|
| Ethernet Switches | 16.52 | 2.40 | 6.59 | 3.27 | 3.95 | 32.72 |
| InfiniBand Switches | 3.80 | 2.78 | 0.31 | 1.15 | 0.05 | 8.08 |
| Scale-Up Fabric Switches | 4.63 | 1.45 | 0.26 | 0.67 | 0.03 | 7.04 |
| Total | 24.95 | 6.63 | 7.16 | 5.08 | 4.02 | 47.85 |
GPU and neocloud providers spend 41.9% of their switch budget on InfiniBand and 21.9% on scale-up switches, the most AI-specific mix of any buyer. Hyperscale cloud providers buy 18.5% of their switches as scale-up fabric, so rack-scale accelerator systems already shape their switch budgets.
The matrix is a DC Market Insights model, not a shipment count. It is built from 59 inputs: 16 annual market totals (2020 to 2035), 12 port and price inputs (ports and price per port for 4 Ethernet speed classes and for InfiniBand, plus scale-up content per accelerator and accelerator count), 27 split shares (3 switch types, 4 network roles, 4 switch layers, 3 switch designs, 3 vendor models, 5 buyers and 5 regions) and 4 vendor disclosures used as a cross-check. The model and its assumptions are explained on our research methodology page.
Regional Insights: Which Region Leads the Data Center Switch Market?
DC Market Insights estimates that North America leads the Data Center Switch Market with 46.8% of 2025 value, and Latin America is the fastest-growing region at 10.24% a year, as cloud and AI capacity spreads from a small base. Asia Pacific adds the most share of any region, rising from 28.6% to 30.3% by 2035.
North America Leads with 46.8% Share
DC Market Insights estimates that North American buyers spent USD 22.41 billion on data center switches in 2025, and the region is forecast to reach USD 46.88 billion by 2035, a CAGR of 7.66%. The United States hosts most of the capacity under construction counted in the market drivers section, and holds USD 20.19 billion of the regional total. North America loses 2.6 points of share by 2035 as other regions catch up, not because its volume falls.
Asia Pacific Holds 28.6% Share
DC Market Insights values Asia Pacific at USD 13.69 billion in 2025 and USD 32.14 billion by 2035, a CAGR of 8.91%. China is the largest market in the region at USD 6.01 billion, with domestic suppliers such as Huawei, H3C, Ruijie and ZTE, and India grows fastest at 13.74% a year.
Europe Holds 14.9% Share
DC Market Insights values Europe at USD 7.15 billion in 2025 and USD 15.46 billion by 2035, a CAGR of 8.02%. The United Kingdom and Germany are the two largest country markets, and DC Market Insights allocates USD 0.52 billion of 2025 spend to Italy, growing 8.45% a year.
Middle East and Africa Holds 5.6% Share
DC Market Insights values the Middle East and Africa at USD 2.69 billion in 2025 and USD 6.51 billion by 2035, a CAGR of 9.23%, the second-fastest of any region. DC Market Insights allocates USD 0.78 billion of 2025 spend to Saudi Arabia and USD 0.71 billion to the United Arab Emirates, growing 10.54% and 10.15% a year, so the two countries supply 65.5% of the region’s growth to 2035 as new AI capacity comes online.
Latin America Holds 4.0% Share
DC Market Insights values Latin America at USD 1.90 billion in 2025 and USD 5.05 billion by 2035, a CAGR of 10.24%, the fastest of any region. Brazil accounts for close to half of regional spend in the DC Market Insights country allocation, and Mexico, at USD 0.43 billion in 2025, grows faster at 11.01% a year.

Country Analysis: Which Countries Spend the Most on Data Center Switches?
DC Market Insights estimates that the United States is the largest country market for data center switches at USD 20.19 billion in 2025, 42.2% of global value, followed by China at USD 6.01 billion (12.6%) and Canada at USD 2.21 billion (4.6%). The 16 countries in the table account for 87.9% of 2025 spending.
| Rank | Country | Region | 2025 (USD billion) | Share 2025 | 2035 (USD billion) | CAGR 2025-2035 |
|---|---|---|---|---|---|---|
| 1 | United States | North America | 20.19 | 42.2% | 41.66 | 7.51% |
| 2 | China | Asia Pacific | 6.01 | 12.6% | 12.67 | 7.74% |
| 3 | Canada | North America | 2.21 | 4.6% | 5.23 | 8.97% |
| 4 | Japan | Asia Pacific | 2.07 | 4.3% | 4.56 | 8.21% |
| 5 | United Kingdom | Europe | 1.63 | 3.4% | 3.34 | 7.42% |
| 6 | Germany | Europe | 1.52 | 3.2% | 3.37 | 8.25% |
| 7 | India | Asia Pacific | 1.50 | 3.1% | 5.42 | 13.74% |
| 8 | Australia | Asia Pacific | 1.01 | 2.1% | 2.52 | 9.57% |
| 9 | South Korea | Asia Pacific | 0.91 | 1.9% | 2.12 | 8.76% |
| 10 | France | Europe | 0.91 | 1.9% | 2.07 | 8.51% |
| 11 | Brazil | Latin America | 0.90 | 1.9% | 2.37 | 10.19% |
| 12 | Saudi Arabia | Middle East and Africa | 0.78 | 1.6% | 2.13 | 10.54% |
| 13 | Netherlands | Europe | 0.72 | 1.5% | 1.43 | 7.12% |
| 14 | United Arab Emirates | Middle East and Africa | 0.71 | 1.5% | 1.86 | 10.15% |
| 15 | Italy | Europe | 0.52 | 1.1% | 1.18 | 8.45% |
| 16 | Mexico | Latin America | 0.43 | 0.9% | 1.21 | 11.01% |
India is the fastest-growing country market at 13.74% a year in DC Market Insights estimates, ahead of Mexico at 11.01%, Saudi Arabia at 10.54% and Brazil at 10.19%. The country figures are a DC Market Insights allocation of the regional totals, weighted by each country’s estimated share of installed general-purpose capacity and of accelerated IT load commissioned.
Forecast Scenarios: How Could the 2035 Forecast Change?
DC Market Insights forecasts the Data Center Switch Market at USD 106.05 billion by 2035 in the base case, with a range of USD 82.73 billion to USD 123.95 billion across the low and high scenarios.
| Scenario | Assumption from 2026 | 2035 (USD billion) | CAGR 2025-2035 |
|---|---|---|---|
| Low | Accelerated capacity commissioned 20% below base in 2035; switch price per port falls 1 point a year faster | 82.73 | 5.63% |
| Base | 1.6T ports reach 66.8% of Ethernet switch value; scale-up switching grows at 9.43% | 106.05 | 8.28% |
| High | Accelerated capacity 15% above base; scale-up fabrics extend across multiple racks | 123.95 | 9.99% |
The high case assumes scale-up fabrics stretch from one rack to many, adding a switch tier that today exists only inside the rack.
Competitive Insights: Who Leads the Data Center Switch Market?
- NVIDIA
- Arista Networks
- Cisco Systems
- Huawei
- Hewlett Packard Enterprise (Juniper Networks)
- Celestica
- Accton Technology
- H3C
- Dell Technologies
- Ruijie Networks
- ZTE
- Nokia
- Broadcom
- Extreme Networks
- Supermicro
- Lenovo
- NEC
NVIDIA is the market leader with about 36% of the Data Center Switch Market in 2025, and NVIDIA, Arista and Cisco together hold close to three-fifths (DC Market Insights estimate: NVIDIA’s full-year networking revenue of more than USD 31 billion, reported in February 2026, less the adapters, cables and optics that fall outside this market’s scope, set against the USD 47.85 billion market). Arista reported 2025 revenue of USD 9.006 billion and second-quarter 2026 revenue of USD 3.036 billion, up 37.7% year over year, and completed the acquisition of Pluribus Networks, a unified cloud fabric pioneer, in 2022; DC Market Insights estimates its share of data center switching at about 15%. Cisco reported fiscal 2026 revenue of USD 63.3 billion, up 12%, and USD 9.3 billion of AI infrastructure orders from hyperscalers. Hewlett Packard Enterprise doubled the size of its networking business by closing the Juniper Networks acquisition in July 2025. Celestica and Accton build white-box and ODM switches for hyperscalers, Broadcom supplies the merchant switch silicon behind many of them, and Huawei, H3C, Ruijie and ZTE lead in China. Dell, Nokia and Extreme Networks compete in enterprise, telecom and sovereign data center switching. Super Micro Computer (Supermicro) sells its own SSE-T8196 switch, with 64 400G downlinks, 32 800G uplinks and up to 51.2 Tbps of throughput, as a leaf for 800G spine-and-leaf fabrics. Lenovo Group offers NVIDIA Spectrum Ethernet switches with Lenovo ordering information, from the 1GbE SN2201 management switch to the SN5610 800GbE platform. NEC Corporation launched a 48-port 10GbE top-of-rack switch and a 32-port 40GbE aggregation switch for large data centers in June 2015.
Recent Developments
- In June 2025, Broadcom began shipping Tomahawk 6, the first switch series with 102.4 terabits per second of switching capacity in a single chip (Source: Broadcom press release).
- In July 2025, Hewlett Packard Enterprise completed its acquisition of Juniper Networks, doubling the size of its networking business (Source: HPE press release).
- In August 2025, Broadcom began shipping the Jericho4 Ethernet fabric router, designed to interconnect over one million XPUs across multiple data centers (Source: Broadcom press release).
- In October 2025, the Open Compute Project launched the Ethernet for Scale-Up Networking (ESUN) workstream (Source: OCP announcement).
- In February 2026, Cisco announced the Silicon One G300, a 102.4 Tbps switching chip, with G300-based systems shipping in 2026 (Source: Cisco press release).
We follow these launches, deals and order disclosures as they happen in our data center industry updates.
Methodology: How We Built the Data Center Switch Market Model
DC Market Insights built this market bottom-up from switch ports and prices. Ethernet switch value in 2025 is 47.37 million ports across 4 speed classes, each priced per port from USD 245 to USD 2,650; InfiniBand value is 6.68 million ports at USD 1,210; and scale-up switching is USD 1,090 of switch content per accelerator across 6.46 million rack-scale accelerators. The annual series from 2020 to 2035 ties switch spend to the DC Market Insights data center networking model, in which switches rise from 43.1% of network spend in 2020 to 62.1% in 2025 and 62.5% in 2035. The total was split by 3 switch types, 4 network roles, 4 switch layers, 3 switch designs, 3 vendor models, 5 buyer types, 4 Ethernet port speeds and 5 regions, and every split sums to its parent total. The result was checked top-down against the disclosed revenue of NVIDIA networking, Arista, Celestica’s Hardware Platform Solutions and Cisco’s AI infrastructure orders, and against published construction counts. Values for 16 countries allocate each regional total by country weights for installed and new capacity. The analyst named on this page built the model, and the reviewer checked the arithmetic, the sources and the dates before publication.
Table of contents
- 01Introduction
- 1.1Market Definition and Scope
- 1.2Switch Types and Switch Layers Covered
- 1.3Exclusions, Including Fibre Channel SAN Switches
- 1.4Currency, Pricing and Base Year
- 1.5Key Stakeholders
- 02Research Methodology
- 2.1Bottom-Up Port and Price Model
- 2.2Top-Down Vendor Revenue Checks
- 2.3Data Sources
- 2.4Assumptions and Limitations
- 03Executive Summary
- 3.1Market Snapshot, 2025 and 2035
- 3.2Key Findings
- 3.3Analyst Viewpoint
- 04Market Dynamics
- 4.1Drivers
- 4.2Trends
- 4.3Challenges
- 4.4Opportunities
- 05Pricing Analysis
- 5.1Price per Port by Ethernet Speed, 2025
- 5.2InfiniBand Price per Port, 2025
- 5.3Scale-Up Switch Content per Accelerator, 2025
- 06Standards and Regulation
- 6.1IEEE P802.3dj Ethernet
- 6.2UEC Specification 1.0
- 6.3UALink 200G 1.0 and OCP ESUN
- 6.4Supply-Chain Rules
- 07Supply Chain and Value Chain
- 7.1Switch Silicon Suppliers
- 7.2Branded Systems, Platforms and ODMs
- 7.3Optics and Co-Packaged Optics Interfaces
- 08Market Size and Forecast
- 8.1Market Value, 2020-2035
- 8.2Year-on-Year Growth
- 8.3Switch Share of Data Center Networking Spend
- 09Market by Switch Type
- 9.1Ethernet Switches
- 9.2InfiniBand Switches
- 9.3Scale-Up Fabric Switches
- 10Market by Network Role
- 10.1AI Back-End Scale-Out Fabric
- 10.2Front-End Leaf and Spine
- 10.3AI Scale-Up Fabric
- 10.4Storage and Management Networks
- 11Market by Switch Design
- 11.1Fixed-Configuration Switches
- 11.2Modular Chassis Switches
- 11.3Scale-Up Switch Trays
- 12Market by Switch Layer
- 12.1Access and Top-of-Rack
- 12.2Aggregation and Distribution
- 12.3Core and Super-Spine
- 12.4In-Rack Scale-Up
- 13Market by Vendor Model
- 13.1Branded Network OEMs
- 13.2Accelerator Platform Vendors
- 13.3ODM and White-Box Suppliers
- 14Market by Ethernet Port Speed
- 14.1100G and Below
- 14.2200G and 400G
- 14.3800G
- 14.41.6T and Above
- 15Market by End-user
- 15.1Hyperscale Cloud Providers
- 15.2GPU and Neocloud Providers
- 15.3Enterprises
- 15.4Government and Research
- 15.5Telecom Service Providers
- 16DC Exclusive: Switch Port Model and Switch Type × Buyer Matrix
- 16.1Switch Type × Buyer Values, 2025
- 16.2Model Inputs
- 17Market by Region
- 17.1North America (United States, Canada)
- 17.2Asia Pacific (China, Japan, India, Australia, South Korea)
- 17.3Europe (United Kingdom, Germany, France, Netherlands, Italy)
- 17.4Middle East and Africa (Saudi Arabia, United Arab Emirates)
- 17.5Latin America (Brazil, Mexico)
- 18Country Analysis
- 18.1Top 16 Countries, 2025 and 2035
- 18.2Fastest-Growing Countries
- 19Regional Cross-Sections
- 19.1Regional Share Shift, 2025 to 2035
- 19.2Regional Growth Ranking, 2025-2035
- 20Forecast Scenarios
- 20.1Low Scenario
- 20.2Base Scenario
- 20.3High Scenario
- 21Competitive Landscape
- 21.1Market Share Estimates, 2025
- 21.2Recent Developments
- 22Company Profiles
- 22.1NVIDIA
- 22.2Arista Networks
- 22.3Cisco Systems
- 22.4Huawei
- 22.5Hewlett Packard Enterprise (Juniper Networks)
- 22.6Celestica
- 22.7Accton Technology
- 22.8H3C
- 22.9Dell Technologies
- 22.10Ruijie Networks
- 22.11ZTE
- 22.12Nokia
- 22.13Broadcom
- 22.14Extreme Networks
- 22.15Supermicro
- 22.16Lenovo
- 22.17NEC
- 23Analyst Recommendations
- 23.1For Switch Vendors
- 23.2For Data Center Operators
- 23.3For Investors
- Fig. 1Data Center Switch Market Size, 2020–2035
- Fig. 2Data Center Switch Market by Region, 2025 and 2035
- Fig. 3Data Center Switch Market by Switch Type, 2025 and 2035
- Fig. 4Ethernet Switch Value by Port Speed, 2025 and 2035
- Fig. 5Switch Type × End-user Matrix, 2025
- Table 1Report Attributes
- Table 2Price per Port by Port Class, 2025
- Table 3Market by Switch Type, 2025 and 2035
- Table 4Market by Network Role, 2025 and 2035
- Table 5Market by Switch Design, 2025 and 2035
- Table 6Market by Vendor Model, 2025 and 2035
- Table 7Market by End-user, 2025 and 2035
- Table 8Ethernet Switch Value by Port Speed, 2025 and 2035
- Table 9Market by Switch Layer, 2025 and 2035
- Table 10Switch Type × End-user Matrix, 2025
- Table 11Market by Region, 2025 and 2035
- Table 12Top 16 Countries, 2025 and 2035
- Table 13Forecast Scenarios, 2035
About this report
Written by Amit Jain and reviewed by Deepti Agrawal, Senior Editor, Research. Figures are built top-down and bottom-up and reconciled before publication, with 2025 as the base year.
Read our methodologyHow we built this
- Historical period2020-2024
- Base year2025
- Forecast period2026-2035
- Sizing approachTop-down + bottom-up
Need more than the report?
Advisory on this market
Due diligence, site selection and market entry work, by the analysts who wrote this report.
See consulting servicesFrequently asked questions
USD 47.85 billion in 2025, rising to USD 106.05 billion by 2035. DC Market Insights estimates the market at USD 13.80 billion in 2020.
8.28% a year from 2025 to 2035. Growth was faster, at 28.23% a year, between 2020 and 2025 as AI clusters added back-end and scale-up switch layers.
Ethernet switches, with USD 32.72 billion or 68.4% of the market in 2025, growing 9.49% a year. InfiniBand switches slip 0.48% a year.
USD 691 per Ethernet port on a blended basis in 2025, from about USD 245 for 100G and below to about USD 2,650 for a 1.6T port, according to DC Market Insights estimates.
North America, with USD 22.41 billion or 46.8% of 2025 value. Latin America grows fastest at 10.24% a year.
NVIDIA leads with about 36% of the market, and NVIDIA, Arista and Cisco together hold close to three-fifths (DC Market Insights estimate). Huawei, Hewlett Packard Enterprise (Juniper Networks), Celestica, Accton Technology, H3C, Dell Technologies, Ruijie Networks, ZTE, Nokia, Broadcom and Extreme Networks also compete.
Hyperscale cloud providers, with USD 24.95 billion or 52.1% of 2025 demand. GPU and neocloud providers grow fastest at 9.66% a year.
1.6T and above, at 41.61% a year, from USD 1.67 billion in 2025 to USD 54.12 billion by 2035, as 200 Gb/s-per-lane signaling becomes the default for AI fabrics.
Licences, delivery and payment
Which licence should I choose?
Single User is a view-only PDF for one person. Multi User adds a printable PDF and the Excel data for unlimited users at one location. Enterprise covers your whole company and includes 100 free analyst hours.
How and when will I receive the report?
By email, within 24–48 business hours of payment, in the formats of your licence.
How can I pay?
Securely through PayPal: with a PayPal account, a debit or credit card, or PayPal Pay Later where available. Prices are in US dollars.
Can I see a sample first?
Yes. Request a free sample and we will email it to you.
Can the report be tailored to my needs?
Yes. We can add countries, segments or data cuts. Talk to an analyst about the scope you need.
Can I get an invoice or pay against a purchase order?
Write to sales@dcmarketinsights.com and our team will help.