
Israel Data Center Market Size, Share & Forecast to 2035
Market at a glance
The Israel Data Center market was worth USD 1,930.0 million in 2025 and is forecast to reach USD 12.87 billion by 2035, growing at a 20.9% CAGR.
 By Amit Jain, Senior Consultant, ICT & Emerging Technologies
 Reviewed by Deepti Agrawal
Last updated 13 Oct 2026
Base year 2025 PDF + Excel
What is inside the report
- 01Introduction
- 02Research Methodology
- 03Executive Summary
- 04Market Scope and Definition: What Is the Israel Data Center Market?
- 05Why Israel Data Center Market Estimates Differ
- 06Israel Data Center Market Drivers
- 07Market Trends
- 08Market Challenges: Grid Freeze and Power Costs
- 09Market Opportunities
- 10Pricing Analysis: Data Center Cost per MW in Israel
- 23chapters
- 2020-2024Historical period
- 2026-2035Forecast period
- —Companies profiled
Segmentation
Full analysis
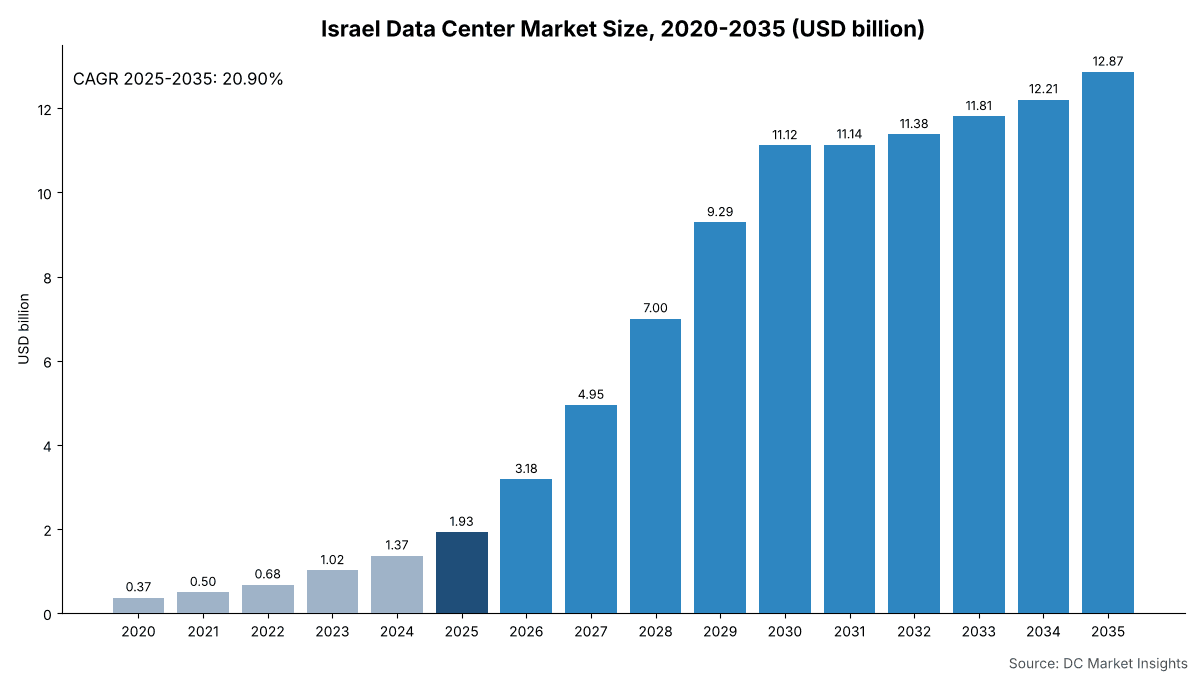
The Israel Data Center Market is valued at USD 3.18 billion in 2026 and is projected to reach USD 12.87 billion by 2035, up from USD 1.93 billion in 2025, a CAGR of 20.90% from 2025 to 2035 (DC Market Insights estimate). The market covers the capital spend on Israeli data centers: the IT infrastructure installed in them (servers, accelerators, storage and networking), power solutions, cooling systems and general construction. The 2025 build receipt is 45 megawatts (MW) of new IT capacity × USD 11.00 million of facility content per MW = USD 495.00 million, plus 20.25 MW of new artificial intelligence (AI) capacity × USD 35.00 million of IT fit-out per MW = USD 708.75 million, plus USD 724.08 million of IT refresh and replacement on 280 MW of installed capacity. Colocation and Wholesale is the fastest-growing segment at 25.43% a year as Nebius, Crusoe and Serverfarm lease AI halls from Israeli developers, and the Southern District is the fastest-growing region at 32.12% a year because the 130 MW Ofek campus in Ashdod and the Masmiyya site move capacity away from the Tel Aviv core.
Key Market Statistics: How Big Is the Israel Data Center Market in 2026?
DC Market Insights values the Israel Data Center Market at USD 3.18 billion in 2026, 65.1% above the USD 1.93 billion of 2025, as new IT capacity rises from 45 MW to 70 MW and AI halls take 60% of it.
- Market size 2025: USD 1.93 billion
- Market size 2026: USD 3.18 billion
- Market size 2030: USD 11.12 billion
- Market size 2035: USD 12.87 billion
- CAGR 2025-2035: 20.90% (low case 17.15%, high case 23.38%)
- Largest component: IT Infrastructure, 74.32% of 2025 spend (USD 1.43 billion)
- Fastest segment: Colocation and Wholesale, 25.43% a year
- Leading region: Central District (incl. Tel Aviv), 60.00% of 2025 spend; fastest-growing region: Southern District, 32.12%
- Largest hub: Petah Tikva, USD 269.90 million in 2025
- Market leader: Amazon Web Services (AWS), about 25% of 2025 spend (DC Market Insights estimate)
Israel Data Center Market Summary: What Did Israel Spend on Data Centers in 2025?
Israel spent USD 1.93 billion on data center infrastructure in 2025. The Israel Data Center Market size was valued at USD 372.40 million in 2020, reached USD 1.93 billion in 2025, and is anticipated to reach USD 12.87 billion by 2035, at a CAGR of 20.90% during the forecast period. Between 2020 and 2025 the market grew at 38.94% a year, as three hyperscale cloud regions opened in Tel Aviv and the AI share of new Israeli capacity rose from 5% to 45%.
| Report Attribute | Details |
|---|---|
| Historical Period | 2020-2024 |
| Base Year | 2025 |
| Forecast Period | 2026-2035 |
| Israel Data Center Market Size 2025 | USD 1.93 billion |
| Israel Data Center Market Size 2026 | USD 3.18 billion |
| Israel Data Center Market CAGR (2025-2035) | 20.90% |
| Israel Data Center Market Size 2035 | USD 12.87 billion |
DC Market Insights estimates that new Israeli IT capacity rises from 45 MW in 2025 to 210 MW in 2030 before the grid limit pulls it back to 140 MW a year, lifting the market to USD 11.12 billion in 2030. The 1,500 MW of new capacity the model adds from 2026 to 2035 equals the 1,500 MW of data center connections the power system has already committed (Source: Globes). Israel is a 0.34% slice of the Data Center Market in 2025, and the facility layer alone is sized in the Israel Data Center Infrastructure Market report.
Key takeaways:
- USD 1.93 billion in 2025, USD 3.18 billion in 2026 and USD 12.87 billion by 2035, a 20.90% CAGR.
- IT Infrastructure is the largest component at 74.32% (USD 1.43 billion) because AI servers cost about three times the building around them.
- Central District leads with 60.00%; the Southern District grows fastest at 32.12%.
- An Israeli data center costs about USD 11.00 million per MW to build in 2025 before servers, and an AI hall needs another USD 35.00 million per MW of IT.
- The July 2026 grid freeze caps the market: new capacity peaks at 210 MW in 2030 in the base case.
What Is the Israel Data Center Market, and What Does It Cover?
The Israel Data Center Market is the annual capital spend on data centers located in Israel, USD 1.93 billion in 2025, across 280 MW of installed IT capacity (DC Market Insights estimate). It runs from 12 MW hyperscale halls in the Tel Aviv area to the 64 MW NVIDIA Corporation (NVIDIA) campus near Yokneam, which Calcalist values at about NIS 4.84 billion (USD 1.5 billion) including equipment (Source: Calcalist (CTech)).
Included: servers, graphics processing unit (GPU) systems, storage and data center networking (IT Infrastructure); medium-voltage switchgear, transformers, uninterruptible power supplies (UPS), generators and power distribution (Power Solutions); chillers, computer room air handlers and liquid cooling (Cooling Systems); and the shell, core and fit-out (General Construction), for cloud, colocation, enterprise and government sites. Excluded: land, electricity bills, power plants built to serve data centers, software licences and cloud or colocation service revenue.
How the segments fit together: each of the four dimensions (component, workload, data center type and end user) splits the same USD 1.93 billion total in 2025 and the same USD 12.87 billion in 2035, and the five Israeli districts and the 12 hubs sum to the same totals.
Why Do Israel Data Center Market Estimates Differ?
Israel Data Center Market estimates differ because publishers count different layers: DC Market Insights puts the market at USD 3.18 billion in 2026 including IT equipment, while the facility layer alone is USD 805.00 million in 2026.
Broader definitions add colocation and cloud service revenue, power purchase costs or land; narrower ones count only the building and its mechanical and electrical plant. Colocation revenue, data center services, managed hosting, edge micro data centers inside telecom exchanges and the electricity bill are out of scope here, as are power plants such as the 840 MW Hagit station that will feed the NVIDIA campus (Source: Calcalist (CTech)). Small and medium-sized enterprises (SMEs), banks, defence buyers and research institutes are in scope when they buy equipment for their own server rooms or for colocation cages.
| Element | In this report | Why |
|---|---|---|
| IT Infrastructure (servers, GPUs, storage, network) | Yes, USD 1.43 billion in 2025 | Largest capital item in an AI hall |
| Power, cooling and construction | Yes, USD 495.00 million in 2025 | Facility layer |
| Colocation and cloud service revenue | No | Recurring revenue, not capital spend |
| Electricity and power plants | No | Operating cost and utility capex |
| Land | No | Not a data center product |
Facility-only spend in 2025 was USD 495.00 million, which matches the Israel Data Center Infrastructure Market definition more closely than this report’s total.
What Drives Israel Data Center Demand After the Grid Freeze?
Three drivers lift Israeli data center spend from USD 1.93 billion in 2025 to USD 11.12 billion in 2030: AI campuses, hyperscale cloud regions and sovereign compute, together behind 210 MW of new capacity in 2030.
AI Campuses Add 150 MW of Leases in 2026
Crusoe’s leasing in Israel reached 150 MW in June 2026 under a reported USD 10 billion plan over 10-15 years (Source: DatacenterDynamics). Nebius signed 80 MW with Mega Or in January 2026, 22 MW in Masmiyya and 58 MW in Beit Shemesh, costing about USD 880 million to build (Source: DatacenterDynamics). DC Market Insights models 60% of 2026’s 70 MW of new capacity as AI halls, worth USD 1.45 billion of new AI IT spend.
Three Hyperscale Regions Anchor Cloud Demand
Google Cloud opened its Tel Aviv region on 19 October 2022 (Source: Google Cloud), AWS opened the Israel (Tel Aviv) Region on 1 August 2023 (Source: AWS), and Microsoft launched Israel Central in October 2023 (Source: DatacenterDynamics). AWS plans to invest up to ILS 26.6 billion in Israel from 2023 to 2037 (Source: AWS), about USD 479 million a year at ILS 3.70 per dollar, or 24.9% of the 2025 market.
Sovereign AI Compute Targets 100,000 Processors
The government approved a National AI Plan on 16 June 2026 with a target of 100,000 processing units (Source: TPS). Its first step, the NIS 500 million national supercomputer awarded to Nebius in May 2025 (Source: Globes), went live in January 2026 with 1,000 NVIDIA B200 GPUs in about 8 MW (Source: DatacenterDynamics). Government and Defence buyers account for USD 289.17 million of 2025 spend.
Which Trends Are Reshaping Israel’s Data Center Build-Out?
AI halls take 59.34% of Israeli data center spend in 2025 and 81.15% by 2035, and capacity moves north and south from the Tel Aviv core.
AI Workloads Grow from USD 1.14 billion to USD 10.44 billion
AI workloads grow at 24.75% a year against 11.96% for conventional workloads. NVIDIA plans a 160,000 square metre campus in Kiryat Tivon (Source: Globes) next to its Yokneam data center.
Developers Build for AI Tenants Before They Sign
Mega Or plans up to 220 MW in Beit Shemesh, with a 20 MW first phase costing USD 200 million (Source: Globes). Colocation and Wholesale rises from 36.00% of spend in 2025 to 52.00% in 2035.
Israeli Capital Backs Data Centers at Home and Abroad
Azrieli Group’s data center net operating income (NOI) reached NIS 449 million in 2025, up 95% (Source: Globes), and Israeli institutions invested about USD 1.03 billion in EdgeConneX in July 2026 (Source: Globes).
What Challenges Hold Back the Israel Data Center Market?
Grid capacity is the binding constraint: pending data center requests total about 27,000 MW against average national demand of about 9,000 MW (Source: Calcalist (CTech)).
A 140-Day Freeze on New Grid Connections
In July 2026 the Electricity Authority ordered Noga, the system operator, to stop processing new data center connections of 8 MW or more for 140 days, until early December 2026 (Source: DatacenterDynamics). The Authority said existing commitments would exhaust planned production capacity through 2035 (Source: Calcalist (CTech)). DC Market Insights therefore holds new capacity to 1,500 MW over 2026-2035, and the low case cuts it by 30% to USD 9.39 billion in 2035.
Power Costs Rise and Requests Outrun Supply
Noga lists 100 separate connection requests, the largest 1,111 MW on the former Alliance site in Hadera (Source: Ynet). The consumer electricity tariff rose 3.5% in January 2025 (Source: Globes) and about 1.5% in January 2026 (Source: The Times of Israel), adding to running costs for 280 MW of installed load.
Where Are the New Revenue Opportunities in Israeli Data Centers?
The largest opportunity is AI IT refresh, which grows from USD 212.45 million in 2025 to USD 5.90 billion in 2035 as installed AI capacity rises from 50.6 MW to 1,084.8 MW.
AI Refresh Reaches USD 5.90 billion
DC Market Insights assumes 20% of installed AI IT is replaced every year, so by 2035 refresh spend exceeds new-build AI IT spend of USD 3.02 billion; server, storage and network vendors with Israeli service teams gain most.
The Southern District Adds USD 2.05 billion
The Ofek data center in Ashdod, built by Serverfarm and the Israel Infrastructure Fund for Dalia Energy, starts at 130 MW, grows to 200 MW and costs about USD 1.5 billion (Source: Globes). Southern District spend rises from USD 134.95 million in 2025 to USD 2.19 billion in 2035, a gain of USD 2.05 billion for contractors, switchgear and cooling suppliers.
How Much Does a Data Center Cost per MW in Israel?
An Israeli data center costs about USD 11.00 million per MW of IT capacity to build in 2025 before servers, rising to USD 15.01 million by 2035; an AI hall adds about USD 35.00 million per MW of IT equipment.
| Price point | 2020 | 2025 | 2030 | 2035 |
|---|---|---|---|---|
| Facility cost per MW (USD million) | 8.00 | 11.00 | 12.94 | 15.01 |
| AI IT fit-out per new AI MW (USD million) | 20.00 | 35.00 | 32.50 | 30.00 |
| Conventional IT spend per installed MW a year (USD million) | 2.20 | 2.50 | 2.65 | 2.80 |
Public anchors: Mega Or puts construction at USD 12 million per MW of IT capacity (Source: DatacenterDynamics); Ofek’s USD 1.5 billion for 130 MW is about USD 11.54 million per MW (Source: Globes); Nebius’s 80 MW at about USD 880 million is USD 11.00 million per MW (Source: DatacenterDynamics); and Mega Or’s 20 MW Beit Shemesh phase at USD 200 million is USD 10.00 million per MW (Source: Globes). On the rental side, Crusoe’s 40 MW Afula lease could be worth USD 3 billion over a decade (Source: Globes), about USD 7.5 million per MW a year.
Which Rules and Standards Shape Israel Data Center Investment?
Four rules shape where USD 3.18 billion of 2026 spend lands: the grid connection freeze, privacy law, data residency in government cloud and the National AI Plan.
- Electricity Authority connection freeze (July 2026): new requests of 8 MW or more are on hold for 140 days (Source: DatacenterDynamics).
- Privacy Protection Law, Amendment 13: in force since 14 August 2025, with stronger enforcement powers for the Privacy Protection Authority (Source: Library of Congress).
- Project Nimbus: the NIS 4 billion (USD 1.2 billion) government cloud tender won by Google and AWS in April 2021 requires local hosting (Source: The Times of Israel).
- National AI Plan (June 2026): a 100,000 processing unit target for sovereign compute (Source: TPS).
- Design standards: operators build to the Uptime Institute Tier classification, ANSI/TIA-942 and ISO/IEC 22237 for facilities, and ISO/IEC 27001 for information security.
Which Segment Leads the Israel Data Center Market, and What Is the Fastest Growing Segment?
IT Infrastructure leads the Israel Data Center Market with 74.32% of 2025 spend (USD 1.43 billion), and Colocation and Wholesale is the fastest growing segment at 25.43% a year to 2035.
By Component: IT Infrastructure Leads with 74.32%
| Component | 2025 (USD million) | Share 2025 | 2035 (USD million) | CAGR 2025-2035 |
|---|---|---|---|---|
| IT Infrastructure | 1,432.83 | 74.32% | 10,764.80 | 22.34% |
| Power Solutions | 222.75 | 11.55% | 903.30 | 15.03% |
| Cooling Systems | 99.00 | 5.14% | 504.17 | 17.68% |
| General Construction | 173.25 | 8.99% | 693.23 | 14.87% |
Cooling Systems grow at 17.68% a year, faster than power and construction, because liquid cooling raises cooling’s share of facility spend from 20% to 24%; the cooling layer is sized in detail in the Israel Data Center Thermal Management Market report.
By Workload: AI Workloads Lead with 59.34%
| Workload | 2025 (USD million) | Share 2025 | 2035 (USD million) | CAGR 2025-2035 |
|---|---|---|---|---|
| AI Workloads | 1,143.95 | 59.34% | 10,440.50 | 24.75% |
| Conventional Workloads | 783.88 | 40.66% | 2,425.00 | 11.96% |
By Data Center Type: Cloud and Hyperscale Leads with 42.00%
| Data Center Type | 2025 (USD million) | Share 2025 | 2035 (USD million) | CAGR 2025-2035 |
|---|---|---|---|---|
| Cloud and Hyperscale | 809.69 | 42.00% | 4,631.58 | 19.05% |
| Colocation and Wholesale | 694.02 | 36.00% | 6,690.06 | 25.43% |
| Enterprise and Government | 424.12 | 22.00% | 1,543.86 | 13.79% |
By End User: IT and Telecom Leads with 54.00%
| End User | 2025 (USD million) | Share 2025 | 2035 (USD million) | CAGR 2025-2035 |
|---|---|---|---|---|
| IT and Telecom | 1,041.03 | 54.00% | 7,976.61 | 22.58% |
| BFSI | 250.62 | 13.00% | 1,286.55 | 17.77% |
| Government and Defence | 289.17 | 15.00% | 1,672.52 | 19.18% |
| Healthcare and Life Sciences | 96.39 | 5.00% | 643.28 | 20.90% |
| Others | 250.62 | 13.00% | 1,286.55 | 17.77% |
Storage is part of IT Infrastructure here; the Israel Data Center Storage Market report sizes it on its own.
DC Exclusive: The Israel Grid-Constrained Project Tracker and District × Component Matrix
Eight named Israeli projects disclose about 330 MW of first-phase or leased capacity, against the 1,500 MW the grid has committed to data centers. This is a DC Market Insights model built from 9 inputs (new IT MW, AI share, facility cost per MW, AI IT per MW, conventional IT per installed MW, refresh rate, installed base, district shares and hub shares) and checked against the 32 facts in the source ledger.
| Project | Developer / tenant | MW | Investment | Status | Ledger |
|---|---|---|---|---|---|
| Ofek, Ashdod | Serverfarm / Israel Infrastructure Fund for Dalia Energy | 130 (200 later) | USD 1.5 billion | H2 2029 | F23 |
| Beit Shemesh | Mega Or (Mega DC) | 20 first phase (up to 220) | USD 200 million (phase 1) | Planned | F24 |
| Masmiyya and Beit Shemesh lease | Nebius from Mega Or | 80 | About USD 880 million | Leased Jan 2026 | F25 |
| Afula | Crusoe from Anan Group | 40 (80 expanded) | About USD 850 million | Leased Apr 2026 | F26 |
| Mevo Carmel / Yokneam | NVIDIA | About 64 | NIS 4.84 billion incl. equipment | Under development | F15 |
| Kfar Yona (two sites) | MedOne | Not disclosed | More than ILS 1 billion | 2026 and 2027 | F22 |
| Rishon LeZion | EdgeConneX | 7.5 (14.5 in Israel) | Not disclosed | Announced Apr 2023 | F20 |
| National AI supercomputer | Nebius for the Israel Innovation Authority | About 8 (phase 1) | NIS 500 million budget | Live Jan 2026 | F17 |
The matrix below splits the 2025 market of USD 1.93 billion by district and component; rows and columns sum to the totals above.
| District (USD million, 2025) | IT Infrastructure | Power Solutions | Cooling Systems | General Construction | Total |
|---|---|---|---|---|---|
| Central District (incl. Tel Aviv) | 859.70 | 133.65 | 59.40 | 103.95 | 1,156.70 |
| Jerusalem District | 171.94 | 26.73 | 11.88 | 20.79 | 231.34 |
| Haifa District | 128.95 | 20.05 | 8.91 | 15.59 | 173.50 |
| Northern District | 171.94 | 26.73 | 11.88 | 20.79 | 231.34 |
| Southern District | 100.30 | 15.59 | 6.93 | 12.13 | 134.95 |
| Total | 1,432.83 | 222.75 | 99.00 | 173.25 | 1,927.83 |
The tracker’s announced facility budgets total about USD 5.1 billion (counting Beit Shemesh once), which the model spreads across 2026-2030, when its facility spend sums to USD 9.04 billion.
Which Israeli Region Leads Data Center Spend, and Which Grows Fastest?
The Central District (incl. Tel Aviv) leads the Israel Data Center Market with 60.00% of 2025 spend (USD 1.16 billion), and the Southern District is the fastest-growing region at 32.12% a year to 2035.
| District | 2025 (USD million) | Share 2025 | 2035 (USD million) | CAGR 2025-2035 |
|---|---|---|---|---|
| Central District (incl. Tel Aviv) | 1,156.70 | 60.00% | 5,146.20 | 16.10% |
| Jerusalem District | 231.34 | 12.00% | 1,672.52 | 21.87% |
| Haifa District | 173.50 | 9.00% | 1,672.52 | 25.43% |
| Northern District | 231.34 | 12.00% | 2,187.14 | 25.19% |
| Southern District | 134.95 | 7.00% | 2,187.14 | 32.12% |
Central District (incl. Tel Aviv) Holds 60.00% Share
The Central District hosts the three hyperscale cloud regions and most colocation; EdgeConneX’s Rishon LeZion site took its Israeli capacity to 14.5 MW (Source: DatacenterDynamics), and MedOne is spending more than ILS 1 billion on two Kfar Yona data centers (Source: MedOne). Its share falls to 40.00% by 2035 as grid headroom shifts elsewhere.
Jerusalem District Holds 12.00% Share
Oracle’s Jerusalem cloud region runs four floors underground at 50 metres (Source: DatacenterDynamics), and Beit Shemesh hosts 58 MW of the Nebius lease; the district grows at 21.87% a year.
Haifa District Holds 9.00% Share
Hadera carries the largest single grid request, 1,111 MW (Source: Ynet); the district grows at 25.43% a year to USD 1.67 billion.
Northern District Holds 12.00% Share
NVIDIA’s 30 MW Yokneam-area site, reported in January 2025 (Source: DatacenterDynamics), and Crusoe’s Afula lease drive 25.19% a year growth.
Southern District Holds 7.00% Share
The 130 MW Ofek campus in Ashdod (Source: Globes) and the 22 MW Masmiyya site lift the Southern District to USD 2.19 billion by 2035, the fastest growth at 32.12% a year.
Which Israeli Hubs Lead Data Center Spend?
Petah Tikva is the largest Israeli data center hub with USD 269.90 million of 2025 spend, and Afula grows fastest at 55.01% a year from a small base as Crusoe’s campus is built.
| Rank | Hub | District | 2025 (USD million) | 2035 (USD million) | CAGR 2025-2035 |
|---|---|---|---|---|---|
| 1 | Petah Tikva | Central District (incl. Tel Aviv) | 269.90 | 1,029.24 | 14.32% |
| 2 | Tel Aviv-Yafo | Central District (incl. Tel Aviv) | 231.34 | 771.93 | 12.81% |
| 3 | Yokneam | Northern District | 192.78 | 1,157.90 | 19.64% |
| 4 | Rishon LeZion | Central District (incl. Tel Aviv) | 173.50 | 771.93 | 16.10% |
| 5 | Jerusalem | Jerusalem District | 154.23 | 643.28 | 15.35% |
| 6 | Modi’in | Central District (incl. Tel Aviv) | 134.95 | 643.28 | 16.90% |
| 7 | Haifa | Haifa District | 96.39 | 643.28 | 20.90% |
| 8 | Kfar Yona | Central District (incl. Tel Aviv) | 77.11 | 643.28 | 23.63% |
| 9 | Hadera | Haifa District | 77.11 | 1,029.24 | 29.58% |
| 10 | Beit Shemesh | Jerusalem District | 77.11 | 1,029.24 | 29.58% |
| 11 | Ashdod | Southern District | 38.56 | 1,029.24 | 38.88% |
| 12 | Afula | Northern District | 9.64 | 771.93 | 55.01% |
Ashdod is the fastest-growing large hub at 38.88% a year, reaching USD 1.03 billion in 2035. Hub values are DC Market Insights allocations inside the district totals; the 12 hubs hold 79.50% of 2025 spend.
How Could the 2035 Israel Data Center Forecast Change? Three Scenarios
The 2035 Israel Data Center Market ranges from USD 9.39 billion to USD 15.76 billion around a base case of USD 12.87 billion, depending on how much grid capacity reaches data centers after the freeze.
| Scenario | 2035 (USD million) | CAGR 2025-2035 | Assumption |
|---|---|---|---|
| Low | 9,388.75 | 17.15% | New capacity from 2027 is 30% below base (freeze extended, 1,071 MW over 2026-2035) |
| Base | 12,865.50 | 20.90% | 1,500 MW of new capacity 2026-2035, equal to committed connections |
| High | 15,762.80 | 23.38% | New capacity from 2027 is 25% above base as new generation is added |
All three scenarios keep 2025 and 2026 unchanged, because projects under construction in 2026 already hold grid connections.
Who Are the Leading Israel Data Center Companies, and What Is Their Market Share?
Amazon Web Services leads the Israel Data Center Market with about 25% of 2025 spend, based on its ILS 26.6 billion 2023-2037 plan averaged per year; DC Market Insights estimates the top three cloud providers (AWS, Google and Microsoft) held about 45% of 2025 spend.
- Amazon Web Services
- Google Cloud
- Microsoft
- Oracle
- NVIDIA
- Nebius
- Crusoe
- Mega Or (Mega DC)
- Serverfarm
- EdgeConneX
- MedOne
- Anan Group
- Azrieli Group
- Schneider Electric
- Vertiv
NVIDIA is the largest single private builder of AI capacity, with a 64 MW campus worth NIS 4.84 billion including equipment (Source: Calcalist (CTech)). Among developers, Mega Or has the largest pipeline: Modi’in (8 MW, open), Beit Shemesh (up to 220 MW), Yokneam (64 MW) and Yoav (32 MW) (Source: Globes). Schneider Electric and Vertiv are listed as the leading power and cooling equipment suppliers.
What Changed in Israel’s Data Center Market in 2026?
Israel added about 230 MW of AI leases in the first half of 2026, then froze new grid connections in July.
- In January 2026, Nebius signed an 80 MW lease with Mega Or in Masmiyya and Beit Shemesh (Source: DatacenterDynamics).
- In January 2026, the first phase of the national AI supercomputer went live with 1,000 NVIDIA B200 GPUs (Source: DatacenterDynamics).
- In February 2026, Serverfarm and the Israel Infrastructure Fund were reported building the 130 MW Ofek campus in Ashdod for Dalia Energy (Source: Globes).
- In April 2026, Crusoe leased 40 MW from Anan Group in Afula (Source: Globes).
- In June 2026, the government approved the National AI Plan with a 100,000 processing unit target (Source: TPS).
- In July 2026, the Electricity Authority froze new data center grid connections for 140 days (Source: Calcalist (CTech)).
More country and segment reports are listed on the DC Market Insights industry page, and the global AI build-out is sized in the AI Data Center Market report.
How Did DC Market Insights Build the Israel Data Center Market Model? (Methodology)
The model multiplies 45 MW by USD 11.00 million per MW for 2025, adds 20.25 MW × USD 35.00 million of AI IT, and adds USD 724.08 million of installed-base IT spend. New Israeli IT capacity (20 MW in 2020, 45 MW in 2025, 210 MW in 2030, 140 MW in 2035; 280 MW installed at the end of 2025) × facility cost per MW gives facility spend; new AI MW (AI share 5% in 2020, 45% in 2025, 72% in 2035) × AI IT per MW gives new AI IT spend; 20% a year of the installed AI base is refreshed; and the installed conventional base × USD 2.50 million per MW a year gives conventional IT spend. Unit values match the Data Center Market model, so Israel is a consistent slice of the global total. District and hub splits are set for 2025 and 2035 and sum to the total.
Three bound checks:
- Ceiling 1: the model’s 1,500 MW of new capacity over 2026-2035 equals the 1,500 MW of connections committed to data centers (Source: Globes), which the Electricity Authority says exhausts planned production capacity through 2035.
- Ceiling 2: the same 1,500 MW is 5.6% of the roughly 27,000 MW of pending requests (Source: Calcalist (CTech)).
- Floor: the tracker’s announced facility budgets of about USD 5.1 billion sit below the model’s USD 9.04 billion of facility spend over 2026-2030.
Full approach: DC Market Insights research methodology.
Table of contents
- 01Introduction
- 1.1Market Definition
- 1.2Historical Period, Base Year and Forecast Period
- 1.3Report Attributes
- 02Research Methodology
- 2.1Build Receipt: New IT Capacity × Facility Cost per MW
- 2.2AI IT Fit-Out, AI Refresh and Conventional IT Spend
- 2.3District and Hub Allocation
- 2.4Bound Checks: Grid Ceilings and Project Floor
- 2.5Model Inputs and Source Ledger
- 03Executive Summary
- 3.1Market Snapshot, 2025, 2026 and 2035
- 3.2Key Market Statistics
- 3.3Key Takeaways
- 04Market Scope and Definition: What Is the Israel Data Center Market?
- 4.1Included: IT Infrastructure, Power Solutions, Cooling Systems and General Construction
- 4.2Excluded: Land, Electricity, Power Plants, Software and Service Revenue
- 4.3How the Segments Fit Together
- 05Why Israel Data Center Market Estimates Differ
- 5.1Full Capital Spend vs Facility Layer
- 5.2Broader and Narrower Definitions
- 5.3Scope Comparison: What Is In and Out
- 06Israel Data Center Market Drivers
- 6.1AI Campuses Add 150 MW of Leases in 2026
- 6.2Three Hyperscale Regions Anchor Cloud Demand
- 6.3Sovereign AI Compute Targets 100,000 Processors
- 07Market Trends
- 7.1AI Workloads Grow from USD 1.14 billion to USD 10.44 billion
- 7.2Developers Build for AI Tenants Before They Sign
- 7.3Israeli Capital Backs Data Centers at Home and Abroad
- 08Market Challenges: Grid Freeze and Power Costs
- 8.1A 140-Day Freeze on New Grid Connections
- 8.2Power Costs Rise and Requests Outrun Supply
- 09Market Opportunities
- 9.1AI Refresh Reaches USD 5.90 billion
- 9.2The Southern District Adds USD 2.05 billion
- 10Pricing Analysis: Data Center Cost per MW in Israel
- 10.1Facility Cost per MW
- 10.2AI IT Fit-Out per New AI MW
- 10.3Conventional IT Spend per Installed MW
- 10.4Public Cost Anchors: Mega Or, Ofek, Nebius and Crusoe
- 11Standards, Policy and Regulation
- 11.1Electricity Authority Connection Freeze (July 2026)
- 11.2Privacy Protection Law, Amendment 13
- 11.3Project Nimbus
- 11.4National AI Plan (June 2026)
- 11.5Design Standards: Uptime Tier, ANSI/TIA-942, ISO/IEC 22237 and ISO/IEC 27001
- 12Israel Data Center Market, By Component
- 12.1IT Infrastructure
- 12.2Power Solutions
- 12.3Cooling Systems
- 12.4General Construction
- 13Israel Data Center Market, By Workload
- 13.1AI Workloads
- 13.2Conventional Workloads
- 14Israel Data Center Market, By Data Center Type
- 14.1Cloud and Hyperscale
- 14.2Colocation and Wholesale
- 14.3Enterprise and Government
- 15Israel Data Center Market, By End User
- 15.1IT and Telecom
- 15.2BFSI
- 15.3Government and Defence
- 15.4Healthcare and Life Sciences
- 15.5Others
- 16DC Exclusive: Israel Grid-Constrained Project Tracker and District × Component Matrix
- 16.1Grid-Constrained Project Tracker (Eight Named Projects)
- 16.2District × Component Matrix, 2025
- 16.3Announced Facility Budgets vs Modelled Facility Spend
- 17Israel Data Center Market, By District
- 17.1Central District (incl. Tel Aviv)
- 17.2Jerusalem District
- 17.3Haifa District
- 17.4Northern District
- 17.5Southern District
- 18Hub Analysis
- 18.1Petah Tikva
- 18.2Tel Aviv-Yafo
- 18.3Yokneam
- 18.4Rishon LeZion
- 18.5Jerusalem
- 18.6Modi'in
- 18.7Haifa
- 18.8Kfar Yona
- 18.9Hadera
- 18.10Beit Shemesh
- 18.11Ashdod
- 18.12Afula
- 19Forecast Scenarios 2035
- 19.1Low Scenario
- 19.2Base Scenario
- 19.3High Scenario
- 20Competitive Landscape
- 20.1Market Share Analysis, 2025
- 20.2Hyperscale Cloud Providers: AWS, Google and Microsoft
- 20.3AI Capacity Builders and Developers
- 20.4Power and Cooling Equipment Suppliers
- 21Company Profiles
- 21.1Amazon Web Services
- 21.2Google Cloud
- 21.3Microsoft
- 21.4Oracle
- 21.5NVIDIA
- 21.6Nebius
- 21.7Crusoe
- 21.8Mega Or (Mega DC)
- 21.9Serverfarm
- 21.10EdgeConneX
- 21.11MedOne
- 21.12Anan Group
- 21.13Azrieli Group
- 21.14Schneider Electric
- 21.15Vertiv
- 22Recent Developments
- 22.1Nebius 80 MW Lease with Mega Or (January 2026)
- 22.2National AI Supercomputer Phase 1 Goes Live (January 2026)
- 22.3Ofek Campus in Ashdod (February 2026)
- 22.4Crusoe Leases 40 MW in Afula (April 2026)
- 22.5National AI Plan Approved (June 2026)
- 22.6Grid Connection Freeze (July 2026)
- 23Appendix and Glossary
- 23.1Abbreviations: MW, AI, GPU, UPS, NOI, SMEs, BFSI, CAGR
- Fig. 1Israel Data Center Market Size, 2020-2035 (USD Million)
- Table 1Report Attributes
- Table 2Scope Comparison
- Table 3Price per MW, 2020-2035
- Table 4Market by Component (USD Million)
- Table 5Market by Workload (USD Million)
- Table 6Market by Data Center Type (USD Million)
- Table 7Market by End User (USD Million)
- Table 8Project Tracker
- Table 9District × Component Matrix, 2025
- Table 10Market by District (USD Million)
- Table 11Top 12 Hubs (USD Million)
- Table 12Forecast Scenarios, 2035
About this report
Written by Amit Jain and reviewed by Deepti Agrawal, Senior Editor, Research. Figures are built top-down and bottom-up and reconciled before publication, with 2025 as the base year.
Read our methodologyHow we built this
- Historical period2020-2024
- Base year2025
- Forecast period2026-2035
- Sizing approachTop-down + bottom-up
Need more than the report?
Advisory on this market
Due diligence, site selection and market entry work, by the analysts who wrote this report.
See consulting servicesFrequently asked questions
USD 3.18 billion in 2026, up 65.1% from USD 1.93 billion in 2025, according to DC Market Insights estimates. The market is projected to reach USD 12.87 billion by 2035 as AI campuses and cloud regions add 1,500 MW of new capacity.
20.90% a year from 2025 to 2035, from USD 1.93 billion to USD 12.87 billion (DC Market Insights estimate). The low and high cases give 17.15% and 23.38%, depending on how much grid capacity data centers receive.
A USD 1.93 billion market in 2025: the capital spend on Israeli data centers, covering IT infrastructure, power solutions, cooling systems and general construction across about 280 MW of installed IT capacity. Land, electricity and colocation service revenue are excluded.
About 280 MW of installed IT capacity at the end of 2025 (DC Market Insights estimate), with 1,500 MW of grid connections committed to data centers and about 27,000 MW of requests pending when the July 2026 freeze began.
Colocation and Wholesale, at 25.43% a year to 2035, as AI cloud tenants such as Nebius and Crusoe lease halls from Israeli developers. IT Infrastructure is the largest component at 74.32% of 2025 spend.
About USD 11.00 million per MW of IT capacity in 2025 before servers, in line with Ofek’s USD 1.5 billion for 130 MW. An AI hall adds about USD 35.00 million per MW of servers, networking and storage.
The Southern District is the fastest growing region of the Israel Data Center Market, at 32.12% a year to 2035, led by the 130 MW Ofek campus in Ashdod. The Central District (incl. Tel Aviv) remains the largest with 60.00% of 2025 spend.
Amazon Web Services leads with about 25% of 2025 spend (DC Market Insights estimate), followed by Google Cloud, Microsoft, Oracle and NVIDIA; Mega Or, Serverfarm, EdgeConneX and MedOne lead among developers.
It pauses new connection requests of 8 MW or more for 140 days from July 2026. DC Market Insights caps new capacity at 1,500 MW over 2026-2035; a 30% shortfall would cut the 2035 market to USD 9.39 billion.
Because publishers count different layers. This estimate of USD 3.18 billion for 2026 includes servers and other IT equipment but excludes land, electricity and colocation revenue; facility-only counts are smaller.
Get this report
How do I get the full report?
Request a quote; we reply by email within one business day.
How and when will I receive the report?
By email, within 24–48 business hours of payment.
How can I pay?
Once you accept the quote, we email you a secure payment link.
Can I see a sample first?
Yes. Request a free sample and we will email it to you.
Can the report be tailored to my needs?
Yes. We can add countries, segments or data cuts. Talk to an analyst about the scope you need.
Can I get an invoice or pay against a purchase order?
Write to sales@dcmarketinsights.com and our team will help.