
Taiwan Data Center Infrastructure Market Size, Share & Forecast to 2035
Market at a glance
The Taiwan Data Center Infrastructure market was worth USD 1,230.0 million in 2025 and is forecast to reach USD 4,220.0 million by 2035, growing at a 13.1% CAGR.
 By Amit Jain, Senior Consultant, ICT & Emerging Technologies
 Reviewed by Deepti Agrawal
Last updated 18 Oct 2026
Base year 2025 PDF + Excel
What is inside the report
- 01Introduction
- 02Executive Summary
- 03Market Overview
- 04Market Drivers
- 05Market Trends
- 06Market Challenges
- 07Market Opportunities
- 08Standards and Regulation
- 09Market Segmentation by Infrastructure Type
- 10Market Segmentation by Project Type
- 19chapters
- 2020-2024Historical period
- 2026-2035Forecast period
- —Companies profiled
Segmentation
Full analysis
The Taiwan Data Center Infrastructure Market is valued at USD 1.66 billion in 2026 and is projected to reach USD 4.22 billion by 2035, up from USD 1.23 billion in 2025, a CAGR of 13.10% from 2025 to 2035 (DC Market Insights estimate). The money in Taiwan moves with one regulator decision: since December 2025 the Ministry of Economic Affairs (MOEA) caps new hyperscale halls at a power usage effectiveness (PUE) of 1.3 and colocation halls at 1.4, which pushes buyers towards liquid-ready cooling plant, higher-efficiency uninterruptible power supply (UPS) systems and medium-voltage switchgear in every new megawatt. Taiwan Data Center Infrastructure covers the electrical, mechanical and cooling, civil, structural and architectural, and rack, cabling and physical network layers that carry IT load; servers, storage, switches, land and electricity bills sit outside it. The 2025 receipt is 95 MW of new IT capacity, 45% of it AI halls, at a blended USD 11.37 million per MW, equal to USD 1.08 billion of new-build spend, plus USD 152.19 million of upgrades on 534 MW in service. Upgrades and Retrofits grow fastest at 17.26% a year because older Taipei halls need denser power to stay leasable, and Southern Taiwan is the fastest region at 17.99% a year as AI compute follows the science parks of Tainan and Kaohsiung.
Key Market Statistics: How Big Is the Taiwan Data Center Infrastructure Market in 2026?
DC Market Insights estimates the Taiwan Data Center Infrastructure Market at USD 1.66 billion in 2026, 34.89% above 2025, because 125 MW of new IT load reaches completion in 2026 against 95 MW a year earlier.
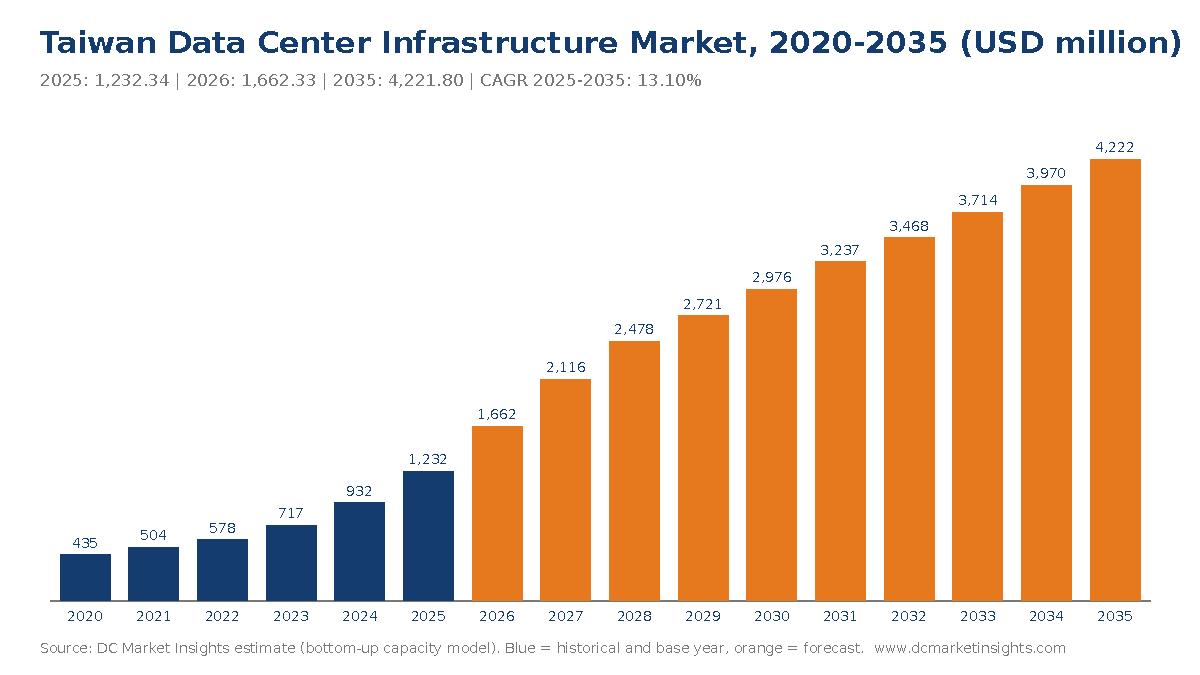
- Market size 2025: USD 1.23 billion; 2026: USD 1.66 billion; 2030: USD 2.98 billion; 2035: USD 4.22 billion.
- CAGR 2025-2035: 13.10% in the base case; 2035 low case USD 3.54 billion, high case USD 4.94 billion.
- Historical CAGR 2020-2025: 23.15%, from USD 435.13 million in 2020.
- Largest segment: Electrical Infrastructure, USD 457.29 million in 2025 (37.1%).
- Fastest infrastructure layer: Rack Cabling and Physical Network Infrastructure, 14.07% a year to USD 332.40 million in 2035.
- Fastest project type: Upgrades and Retrofits, 17.26% a year.
- Leading region: Northern Taiwan, USD 764.05 million in 2025 (62.0%).
- Fastest region: Southern Taiwan, 17.99% a year to USD 1.22 billion in 2035.
- Largest city or county: Taoyuan City, USD 234.14 million in 2025 (19.0%).
- Market leader: Delta Electronics, with an estimated 11% share of 2025 power and cooling equipment value (DC Market Insights estimate).
Analyst Takeaways: What Should Buyers of Taiwan Data Center Infrastructure Know?
Four takeaways follow from the USD 1.23 billion 2025 base, each with its reason.
- Electrical spend stays the largest line at 36.9% of the 2035 market, because every AI hall needs about USD 5.00 million of power train per MW against USD 3.68 million in a conventional hall.
- Cooling gains share, from 31.5% in 2025 to 32.5% in 2035, because the MOEA PUE 1.3 cap rules out legacy chilled-water designs in new hyperscale halls.
- Upgrades and Retrofits rise from 12.3% to 17.7% of the market, because 534 MW of halls in service in 2024 grows to more than 2,100 MW by 2034 and each installed MW absorbs about USD 285,000 a year.
- Southern Taiwan doubles its share of new spend, from 19.0% to 29.0%, because grid headroom north of Taoyuan is limited and national AI compute projects sit in Tainan and Kaohsiung.
Executive Summary: What Does Taiwan Spend on Data Center Power, Cooling and Build-Out?
The Taiwan Data Center Infrastructure Market size was valued at USD 435.13 million in 2020, reached USD 1.23 billion in 2025, and is anticipated to reach USD 4.22 billion by 2035, at a CAGR of 13.10% during the forecast period.
| Attribute | Detail |
|---|---|
| Historical period | 2020-2024 |
| Base year | 2025 |
| Forecast period | 2026-2035 |
| Market size 2025 | USD 1.23 billion |
| Market size 2026 | USD 1.66 billion |
| CAGR 2025-2035 | 13.10% |
| Market size 2035 | USD 4.22 billion |
Growth comes from capacity, not price: DC Market Insights models new IT completions rising from 95 MW in 2025 to 195 MW in 2030 and 235 MW in 2035, while content per MW escalates only 2% a year. AI halls carry USD 13.35 million of infrastructure per MW in 2025 against USD 9.75 million for a conventional hall, so the AI share of new capacity, 45% in 2025 and 66% by 2035, lifts spend faster than megawatts. Amazon said in June 2025 that it plans to invest more than USD 5 billion in its Taiwan data centers (Source: Amazon), and the parent Taiwan Data Center Market report counts USD 2.11 billion of total data center spend in 2025, of which this infrastructure layer is 58.5%.
What Counts as Data Center Infrastructure in Taiwan, and What Is Left Out?
DC Market Insights values Taiwan data center infrastructure at USD 1.23 billion in 2025, counting only the physical layers that carry IT load inside Taiwanese colocation, hyperscale, enterprise and edge facilities.
Included: medium-voltage and low-voltage switchgear, transformers, UPS systems, batteries, generators, busway and power distribution units (PDUs); chillers, cooling towers, computer room air handlers, in-row units, coolant distribution units and liquid-cooling loops; civil works, structural steel, raised floors, containment, fire detection and suppression, physical security and the building envelope fit-out; racks, structured cabling, cable trays, fibre distribution frames and rack-level sensors.
Excluded: servers, storage arrays and network switches; land, shell leases and electricity; facility management services; and Data Center Infrastructure Management (DCIM) software, which DC Market Insights sizes separately in the Taiwan Data Center Infrastructure Management (DCIM) Market report. The boundary is simple: DC Market Insights counts here the hardware that DCIM software watches, not the software itself.
How the segments fit together: every 2025 dollar sits once in each of four dimensions: infrastructure type, project type (new build versus upgrades), data center type and tier standard. The four regional rows and the 12 city and county rows add up inside the national total.
Why Do Taiwan Data Center Infrastructure Market Estimates Differ?
Published estimates for the Taiwan Data Center Infrastructure Market differ widely, while DC Market Insights puts 2026 at USD 1.66 billion, because some definitions add the IT hardware that fills the halls.
Broader definitions fold in servers, storage and switching, which in Taiwan are dominated by AI server racks assembled by Foxconn, Quanta Computer and Wiwynn; DC Market Insights counts that layer in the parent market instead. Other definitions add DCIM software, managed services or the cost of land and electricity, or they count equipment exported from Taiwanese factories rather than installed in Taiwanese halls. Narrower definitions keep only electrical and mechanical plant and drop construction, racks and cabling. Small and mid-sized enterprises (SMEs), banks, hospitals and government agencies that build their own server rooms stay in scope through the Enterprise and Edge rows.
| Element | In this report | Why |
|---|---|---|
| Power, cooling, construction, racks and cabling | Yes, USD 1,232.34 million | Physical layers that carry IT load |
| Servers, storage and network switches | No | IT equipment, counted in the parent market |
| DCIM software and monitoring platforms | No | Sized in the DCIM report |
| Exports of Taiwanese power and cooling equipment | No | Installed outside Taiwan |
| Land, electricity and operations | No | Operating cost, not infrastructure |
What Drives Taiwan Data Center Infrastructure Demand Through 2035?
Three Taiwan-specific forces add about USD 2.99 billion of annual spend between 2025 and 2035, led by the MOEA efficiency rule, rack densities that reach 200 kW per cabinet, and a shift of AI compute to the south.
The MOEA PUE 1.3 Cap Raises Cooling and Power Content per MW
In December 2025 the MOEA required data centers with contracted capacity of 5 MW or more to file an approved Energy Utilization Manual and set PUE caps of 1.3 for hyperscale and 1.4 for colocation halls (Source: Ministry of Economic Affairs). A PUE of 1.3 leaves 0.3 W of overhead for every watt of IT load, which typical air-cooled designs of the early 2020s did not reach in Taiwan’s humid subtropical summers. Buyers respond with free-cooling chillers, rear-door and direct-to-chip liquid loops and UPS systems above 97% efficiency. DC Market Insights estimates that the rule adds about USD 0.6 million per AI MW to mechanical content, part of the USD 4.50 million cooling line in an AI hall, and that Mechanical and Cooling Infrastructure reaches USD 1.37 billion by 2035, growing 13.46% a year.
Rack Densities of 10 kW to 200 kW at Chief Telecom LY2 Reset the Power Train
Chief Telecom designed its LY2 AI data center in Taipei for about 1,800 racks at 10 kW to 200 kW per cabinet, supplied with 20 MW from dual Taipower stations (Source: Chief Telecom). A 200 kW cabinet needs busway, liquid-cooled rear doors or coolant distribution units and heavier floor loading than a 6 kW enterprise rack. That is why an AI hall in Taiwan carries USD 5.00 million of electrical infrastructure per MW in 2025 against USD 3.68 million in a conventional hall, and why Electrical Infrastructure grows at 13.03% a year to USD 1.56 billion by 2035.
Science-Park AI Compute Pulls New Builds to Tainan and Kaohsiung
The National Center for High-performance Computing (NCHC) opened a cloud computing center with 15 MW of installed power at the Southern Taiwan Science Park in December 2025, according to the National Science and Technology Council (NSTC), and Foxconn is building an advanced computing center of 64 racks and 4,608 graphics processing units (GPUs) in Kaohsiung, according to Foxconn. Each of these projects buys substation connections, medium-voltage switchgear and cooling plant from scratch. DC Market Insights values Southern Taiwan infrastructure at USD 234.14 million in 2025 and USD 1.22 billion in 2035, the fastest regional rate at 17.99% a year.
Which Trends Are Changing How Taiwan Builds Data Center Infrastructure?
Two trends shift about 9% of 2030 spend, USD 0.27 billion, towards factory-built and locally made modules and towards on-site energy links.
Foxconn and TECO Push Prefabricated Power and Cooling Modules
Foxconn and TECO Electric and Machinery formed an AI data center alliance through a share swap in July 2025 to move data center construction towards standardisation and modularisation, according to TECO. Prefabricated power skids and cooling modules cut site work in a market where Taipei construction labour is scarce. DC Market Insights estimates that modular and prefabricated delivery accounts for about 18% of 2025 new-build infrastructure value, or USD 194 million, rising to about 30% by 2030.
Corporate Geothermal and Renewable Deals Add On-Site Electrical Work
Google signed Taiwan’s first corporate geothermal agreement in April 2025 for an initial 10 MW from Baseload Capital, according to Google. Renewable supply agreements bring extra metering, switchyards and battery storage at the campus edge. DC Market Insights counts about USD 0.15 million per MW of such grid-interface equipment inside the electrical line of hyperscale halls in 2025.
What Holds Back Taiwan Data Center Infrastructure Spending?
Two constraints, grid headroom and resilience cost, take about USD 685 million out of the 2035 base case in the low scenario.
Grid Bottlenecks North of Taoyuan and Higher Tariffs
The MOEA acknowledged in October 2024 that several areas north of Taoyuan face grid bottlenecks, and the April 2024 tariff decision raised prices for internet data centers using 50 GWh or more a year by 15% to 25%, according to the MOEA. The average industrial price reached NT$4.29 per kWh from 16 October 2024, according to the MOEA. Delayed grid connections push completions into later years: a one-year slip on 50 MW defers about USD 590 million of infrastructure orders at 2026 content values.
Subsea Cable Incidents Raise Redundancy Cost
Taiwan recorded seven submarine cable incidents in 2025, three of them from anchor dragging (42.9%), according to the Ministry of Digital Affairs (MODA). Operators answer with diverse fibre routes, extra generator autonomy and second sites, which add cost without adding leasable megawatts. DC Market Insights estimates that resilience upgrades take about 2% of 2025 spend, USD 25 million, and that the money comes out of new-capacity budgets for smaller enterprise operators.
Where Are the Largest Taiwan Data Center Infrastructure Opportunities?
Two pools hold USD 1.97 billion of 2035 spend: retrofits of halls already in service and Southern Taiwan new builds.
Retrofitting Taipei-Era Halls for Denser AI Loads Reaches USD 748.14 Million by 2035
Upgrades and Retrofits are worth USD 152.19 million in 2025 and grow 17.26% a year because each installed MW absorbs about USD 285,000 of power, cooling and cabling refresh a year. Halls built for 4 kW to 8 kW racks in New Taipei City and Taipei City need new busway, rear-door cooling and floor reinforcement to lease AI tenants, and owners cannot easily get new grid capacity in the north.
Southern Taiwan New Builds Reach USD 1.22 Billion by 2035
Southern Taiwan adds about USD 990 million of annual infrastructure spend between 2025 and 2035. Suppliers with service teams in Tainan and Kaohsiung, close to the science-park campuses, gain because medium-voltage gear and chillers need local commissioning and maintenance.
How Much Does Data Center Infrastructure Cost per MW in Taiwan?
A conventional Taiwanese data hall costs USD 9.75 million per MW of IT load in infrastructure in 2025 and an AI hall USD 13.35 million, DC Market Insights estimates, rising 2% a year.
| Year | Conventional hall | AI hall | Blended new build |
|---|---|---|---|
| 2020 | 8.83 | 12.09 | 8.99 |
| 2025 | 9.75 | 13.35 | 11.37 |
| 2030 | 10.76 | 14.74 | 13.31 |
| 2035 | 11.89 | 16.27 | 14.78 |
Public anchors fit this range. Chief Telecom’s LY2 takes 20 MW of utility power, which at USD 13.35 million per MW implies about USD 267 million of AI-ready infrastructure for one campus. The 2025 price for electricity, NT$4.29 per kWh for industry, does not enter the market value but drives buyers to pay more for efficiency: each 0.1 point of PUE saved on 10 MW of IT load cuts about 8,760 MWh a year, about NT$37.6 million at that price.
Which Rules and Standards Shape Taiwan Data Center Infrastructure?
Four rule sets decide what about USD 1.08 billion of 2025 new-build spend must contain.
- MOEA Energy Utilization Manual and PUE caps (December 2025): data centers of 5 MW or more contracted capacity need an approved manual; PUE caps of 1.3 for hyperscale and 1.4 for colocation, according to the MOEA.
- Taipower tariff rules (April and October 2024): internet data centers above 50 GWh a year pay 15% to 25% more; industry pays NT$4.29 per kWh on average, according to the MOEA.
- Grid Resilience Enhancement Construction Plan (2022): a ten-year programme with planned investment of NT$564.5 billion, which sets where new substations come first (Source: International Energy Agency policy database).
- Design standards: ANSI/TIA-942 and ISO/IEC 22237 for data center design, and Tier III and Tier IV design classes; Tier IV halls are worth USD 271.12 million in 2025 and grow 17.42% a year.
Which Taiwan Data Center Infrastructure Segment Carries the Most Value?
Electrical Infrastructure carries the most value at USD 457.29 million in 2025, 37.1% of the Taiwan Data Center Infrastructure Market, while Upgrades and Retrofits grow fastest at 17.26% a year.
Taiwan Data Center Infrastructure Market by Infrastructure Type
Rack Cabling and Physical Network Infrastructure grows fastest of the four layers at 14.07% a year, because AI halls need USD 0.85 million of racks, structured cabling and fibre per MW against USD 0.55 million in a conventional hall.
| Infrastructure Type | 2025 (USD million) | Share 2025 | 2035 (USD million) | CAGR 2025-2035 |
|---|---|---|---|---|
| Electrical Infrastructure | 457.29 | 37.1% | 1,555.76 | 13.03% |
| Mechanical and Cooling Infrastructure | 387.85 | 31.5% | 1,371.62 | 13.46% |
| Civil Structural and Architectural | 298.09 | 24.2% | 962.02 | 12.43% |
| Rack Cabling and Physical Network Infrastructure | 89.11 | 7.2% | 332.40 | 14.07% |
Taiwan Data Center Infrastructure Market by Project Type
New Build holds 87.7% of 2025 value, USD 1.08 billion, while Upgrades and Retrofits reach USD 748.14 million by 2035.
| Project Type | 2025 (USD million) | Share 2025 | 2035 (USD million) | CAGR 2025-2035 |
|---|---|---|---|---|
| New Build | 1,080.15 | 87.7% | 3,473.66 | 12.39% |
| Upgrades and Retrofits | 152.19 | 12.3% | 748.14 | 17.26% |
Taiwan Data Center Infrastructure Market by Data Center Type
Colocation Data Centers take 38.0% of 2025 value, but Hyperscale and Cloud Data Centers take 45.0% of the 2035 market, growing 16.32% a year as Amazon Web Services (AWS), Google and Microsoft build their own Taiwan campuses.
| Data Center Type | 2025 (USD million) | Share 2025 | 2035 (USD million) | CAGR 2025-2035 |
|---|---|---|---|---|
| Colocation Data Centers | 468.29 | 38.0% | 1,393.19 | 11.52% |
| Hyperscale and Cloud Data Centers | 418.99 | 34.0% | 1,899.81 | 16.32% |
| Enterprise Data Centers | 246.47 | 20.0% | 506.62 | 7.47% |
| Edge Data Centers | 98.59 | 8.0% | 422.18 | 15.66% |
Taiwan Data Center Infrastructure Market by Tier Standard
Tier III holds 66.0% of 2025 value, USD 813.34 million, and Tier IV grows fastest at 17.42% a year because banks and AI clouds pay for concurrent maintainability and fault tolerance.
| Tier Standard | 2025 (USD million) | Share 2025 | 2035 (USD million) | CAGR 2025-2035 |
|---|---|---|---|---|
| Tier I and II | 147.88 | 12.0% | 253.31 | 5.53% |
| Tier III | 813.34 | 66.0% | 2,617.52 | 12.40% |
| Tier IV | 271.12 | 22.0% | 1,350.97 | 17.42% |
DC Exclusive: The Taiwan Hall Cost-per-MW Teardown, Conventional vs AI
An AI hall in Taiwan needs USD 3.60 million more infrastructure per MW than a conventional hall in 2025, USD 13.35 million against USD 9.75 million, DC Market Insights estimates. The teardown is modelled from 14 inputs (content per MW by layer, AI share, upgrade rates and the MOEA PUE cap), so every cell is an estimate, not a quoted price.
| Layer | Conventional hall | AI hall | Difference |
|---|---|---|---|
| Electrical Infrastructure | 3.68 | 5.00 | +1.32 |
| Mechanical and Cooling Infrastructure | 2.76 | 4.50 | +1.74 |
| Civil Structural and Architectural | 2.76 | 3.00 | +0.24 |
| Rack Cabling and Physical Network Infrastructure | 0.55 | 0.85 | +0.30 |
| Total | 9.75 | 13.35 | +3.60 |
Cooling accounts for USD 1.74 million of the USD 3.60 million gap, because a PUE 1.3 hall with 100 kW-plus racks needs coolant distribution units and liquid loops; electrical adds USD 1.32 million for larger UPS blocks and busway. Buyers comparing bids can use the teardown to test whether a quote sits inside the estimated band.
Which Part of Taiwan Leads Data Center Infrastructure Spending?
Northern Taiwan leads with USD 764.05 million in 2025, 62.0% of the market, while Southern Taiwan grows fastest at 17.99% a year to USD 1.22 billion by 2035.
Northern Taiwan
Taoyuan City, New Taipei City and Taipei City hold the cable landings, the interconnection hubs and Microsoft’s first Taiwan data centers in Taoyuan, according to Microsoft. Grid limits north of Taoyuan slow new builds, so the region grows 10.70% a year to USD 2.11 billion by 2035 and leans more on retrofits.
Central Taiwan
Changhua County hosts the Google campus, where Google has invested more than USD 1.6 billion since 2011, according to Google. Central Taiwan grows 14.37% a year, from USD 209.50 million in 2025 to USD 802.14 million in 2035.
Southern Taiwan
The NCHC 15 MW cloud computing center at the Southern Taiwan Science Park and Foxconn’s Kaohsiung computing center make the south the fastest region, at 17.99% a year.
Eastern Taiwan and Offshore Islands
Hualien, Taitung and the Penghu islands hold USD 24.65 million in 2025, mostly telecom edge sites; the February 2025 disconnection of the Taiwan-Penghu No. 3 cable, reported by MODA, keeps redundancy spending here at about 13.10% a year growth.
Which Taiwanese Cities and Counties Spend Most on Data Center Infrastructure?
Taoyuan City spends the most at USD 234.14 million in 2025, and Kaohsiung City grows fastest among large locations at 18.73% a year to USD 548.83 million by 2035.
| Rank | City or county | Region | 2025 | 2035 | CAGR 2025-2035 |
|---|---|---|---|---|---|
| 1 | Taoyuan City | Northern Taiwan | 234.14 | 717.71 | 11.85% |
| 2 | New Taipei City | Northern Taiwan | 209.50 | 548.83 | 10.11% |
| 3 | Taipei City | Northern Taiwan | 172.53 | 379.96 | 8.21% |
| 4 | Tainan City | Southern Taiwan | 110.91 | 548.83 | 17.34% |
| 5 | Kaohsiung City | Southern Taiwan | 98.59 | 548.83 | 18.73% |
| 6 | Changhua County | Central Taiwan | 98.59 | 337.75 | 13.10% |
| 7 | Hsinchu City and County | Northern Taiwan | 86.26 | 253.31 | 11.37% |
| 8 | Taichung City | Central Taiwan | 61.61 | 253.31 | 15.19% |
| 9 | Yunlin County | Central Taiwan | 36.97 | 168.87 | 16.40% |
| 10 | Keelung City | Northern Taiwan | 36.97 | 126.65 | 13.10% |
| 11 | Yilan County | Northern Taiwan | 24.65 | 84.44 | 13.10% |
| 12 | Miaoli County | Central Taiwan | 12.32 | 42.22 | 13.11% |
The 12 locations hold 96.0% of 2025 value; the remaining 4.0% sits in smaller counties. Kaohsiung and Tainan together rise from 17.0% to 26.0% of the market.
How Could the 2035 Taiwan Data Center Infrastructure Forecast Change?
The 2035 Taiwan Data Center Infrastructure Market ranges from USD 3.54 billion to USD 4.94 billion around the USD 4.22 billion base case, depending on how fast Taipower connects new load.
| Scenario | 2035 (USD million) | CAGR 2025-2035 | Assumption |
|---|---|---|---|
| Low | 3,536.60 | 11.12% | Grid approvals slip; new IT completions about 16% below base after 2027 |
| Base | 4,221.80 | 13.10% | 235 MW completed in 2035; AI share 66% |
| High | 4,935.71 | 14.88% | Southern substations arrive early; sovereign AI programmes add about 40 MW a year |
Who Supplies Taiwan Data Center Infrastructure, and How Concentrated Is It?
The top five suppliers hold about 41% of 2025 power and cooling equipment value, DC Market Insights estimates (basis: installed equipment value in Taiwanese data halls, excluding construction).
- Delta Electronics
- Schneider Electric
- Vertiv
- ABB
- Eaton
- Fortune Electric
- TECO Electric and Machinery
- Chung-Hsin Electric and Machinery
- Shihlin Electric
- Trane Technologies
- Daikin
- Johnson Controls
- Asia Vital Components
- Auras Technology
- Fu Sheng Industrial (Hanbell)
- Panduit
- CommScope
Delta Electronics leads with about 11% of power and cooling equipment value; Delta reported consolidated sales of NT$57.06 billion for September 2025 alone, according to Delta Electronics. Schneider Electric and Vertiv follow in UPS, switchgear and thermal systems, while Fortune Electric, Shihlin Electric and Chung-Hsin Electric and Machinery supply transformers and medium-voltage gear. Asia Vital Components (AVC) and Auras Technology supply liquid-cooling parts, and TECO Electric and Machinery competes in modular power and cooling after its July 2025 alliance with Foxconn. Construction is fragmented across local general contractors.
What Has Changed in Taiwan Data Center Infrastructure Since 2025?
Six dated events between May and December 2025 set the pace for new infrastructure orders.
- In May 2025, Foxconn, NVIDIA Corporation (NVIDIA) and the Taiwan government announced an AI factory with 10,000 NVIDIA Blackwell GPUs (Source: NVIDIA).
- In June 2025, Amazon launched the AWS Asia Pacific (Taipei) Region and said it plans to invest more than USD 5 billion in Taiwan data centers (Source: Amazon).
- In July 2025, Chunghwa Telecom announced a hyperscale data center in northern Taiwan for at least 12 MW of IT load (Source: Chunghwa Telecom).
- In July 2025, Foxconn and TECO Electric and Machinery formed an AI data center alliance through a share swap (Source: TECO).
- In November 2025, Foxconn and Visionbay.ai announced a sovereign AI supercomputing center on NVIDIA GB300 NVL72 systems, due online in the first half of 2026 (Source: Foxconn).
- In December 2025, the MOEA set PUE caps of 1.3 for hyperscale and 1.4 for colocation data centers (Source: Ministry of Economic Affairs).
Methodology: How the Taiwan Data Center Infrastructure Model Works
DC Market Insights built the Taiwan Data Center Infrastructure Market model from 16 annual capacity cohorts (2020-2035), 14 inputs and 4 regions, and the 2025 receipt is 95 MW × USD 11.37 million per MW = USD 1.08 billion of new build plus 534 MW × USD 285,000 = USD 152.19 million of upgrades.
New IT completions (40 MW in 2020, 95 MW in 2025, 195 MW in 2030, 235 MW in 2035) are split into conventional and AI halls; each carries content per MW by layer; installed capacity (621 MW at end-2025, 1.5% retired a year) carries an upgrade rate. Prices escalate 2% a year. Every segment, region and city row is allocated from the same total and re-added in Python.
Bound checks: (1) ceiling: the infrastructure layer is 58.5% of the USD 2.11 billion 2025 total in the parent Taiwan Data Center Market model, and its power, cooling and construction lines match the parent within 0.2%; (2) ceiling: modelled installed IT of 1,042 MW in 2028 needs about 1.35 GW at PUE 1.3, below the 2.24 GW of AI electricity demand the MOEA projected for 2028 (Source: Ministry of Economic Affairs); (3) floor: Amazon’s more-than-USD-5-billion pledge implies at least about USD 130 million a year of Taiwan infrastructure from one operator if 40% goes to facility layers over 15 years. Full method notes are in the DC Market Insights research methodology; related reading: Taiwan Data Center Cooling Market and Taiwan AI Data Center Market.
Table of contents
- 01Introduction
- 1.1Market Definition and Scope
- 1.2Included and Excluded Infrastructure
- 1.3How the Segments Fit Together
- 1.4Why Estimates Differ
- 02Executive Summary
- 2.1Key Market Statistics
- 2.2Analyst Takeaways
- 2.3Market Size Chart, 2020-2035
- 03Market Overview
- 3.1Market Snapshot, 2025, 2026 and 2035
- 3.2Cost per MW of IT Load, 2020-2035
- 04Market Drivers
- 4.1The MOEA PUE 1.3 Cap
- 4.2Rack Densities of 10 kW to 200 kW at Chief Telecom LY2
- 4.3Science-Park AI Compute in Tainan and Kaohsiung
- 05Market Trends
- 5.1Prefabricated Power and Cooling Modules
- 5.2Corporate Geothermal and Renewable Deals
- 06Market Challenges
- 6.1Grid Bottlenecks North of Taoyuan and Higher Tariffs
- 6.2Subsea Cable Incidents and Redundancy Cost
- 07Market Opportunities
- 7.1Retrofits of Taipei-Era Halls
- 7.2Southern Taiwan New Builds
- 08Standards and Regulation
- 8.1MOEA Energy Utilization Manual and PUE Caps
- 8.2Taipower Tariff Rules
- 8.3Grid Resilience Enhancement Construction Plan
- 8.4Design Standards and Tier Classes
- 09Market Segmentation by Infrastructure Type
- 9.1Electrical Infrastructure
- 9.2Mechanical and Cooling Infrastructure
- 9.3Civil Structural and Architectural
- 9.4Rack Cabling and Physical Network Infrastructure
- 10Market Segmentation by Project Type
- 10.1New Build
- 10.2Upgrades and Retrofits
- 11Market Segmentation by Data Center Type
- 11.1Colocation Data Centers
- 11.2Hyperscale and Cloud Data Centers
- 11.3Enterprise Data Centers
- 11.4Edge Data Centers
- 12Market Segmentation by Tier Standard
- 12.1Tier I and II
- 12.2Tier III
- 12.3Tier IV
- 13DC Exclusive: Taiwan Hall Cost-per-MW Teardown
- 13.1Conventional Hall Cost by Layer
- 13.2AI Hall Cost by Layer
- 13.3Where the USD 3.60 Million Gap Comes From
- 14Regional Insights
- 14.1Northern Taiwan
- 14.2Central Taiwan
- 14.3Southern Taiwan
- 14.4Eastern Taiwan and Offshore Islands
- 15City and County Analysis
- 15.1Taoyuan City
- 15.2New Taipei City
- 15.3Taipei City
- 15.4Tainan City
- 15.5Kaohsiung City
- 15.6Changhua County
- 15.7Hsinchu City and County
- 15.8Taichung City
- 15.9Yunlin County
- 15.10Keelung City
- 15.11Yilan County
- 15.12Miaoli County
- 16Forecast Scenarios
- 16.1Low Scenario
- 16.2Base Scenario
- 16.3High Scenario
- 17Competitive Insights
- 17.1Delta Electronics
- 17.2Schneider Electric
- 17.3Vertiv
- 17.4ABB
- 17.5Eaton
- 17.6Fortune Electric
- 17.7TECO Electric and Machinery
- 17.8Chung-Hsin Electric and Machinery
- 17.9Shihlin Electric
- 17.10Trane Technologies
- 17.11Daikin
- 17.12Johnson Controls
- 17.13Asia Vital Components
- 17.14Auras Technology
- 17.15Fu Sheng Industrial (Hanbell)
- 17.16Panduit
- 17.17CommScope
- 17.18Market Concentration
- 18Recent Developments
- 18.1May 2025 to December 2025 Events
- 19Methodology
- 19.1Capacity Cohorts and Content per MW
- 19.2Bound Checks
- Fig. 1Taiwan Data Center Infrastructure Market Size, 2020-2035
- Table 1Taiwan Data Center Infrastructure Market Snapshot
- Table 2Scope Comparison, Taiwan, 2025
- Table 3Cost per MW of IT Load, 2020-2035
- Table 4Market by Infrastructure Type
- Table 5Market by Project Type
- Table 6Market by Data Center Type
- Table 7Market by Tier Standard
- Table 8DC Exclusive Teardown: Cost per MW by Layer, 2025
- Table 9Top 12 Cities and Counties
- Table 10Forecast Scenarios, 2035
About this report
Written by Amit Jain and reviewed by Deepti Agrawal, Senior Editor, Research. Figures are built top-down and bottom-up and reconciled before publication, with 2025 as the base year.
Read our methodologyHow we built this
- Historical period2020-2024
- Base year2025
- Forecast period2026-2035
- Sizing approachTop-down + bottom-up
Need more than the report?
Advisory on this market
Due diligence, site selection and market entry work, by the analysts who wrote this report.
See consulting servicesFrequently asked questions
USD 1.66 billion in 2026, up 34.89% from USD 1.23 billion in 2025, DC Market Insights estimates. The market is projected to reach USD 4.22 billion by 2035, a CAGR of 13.10% from 2025, as new IT completions rise from 95 MW to 235 MW a year.
USD 4.22 billion by 2035 in the base case, with a range of USD 3.54 billion to USD 4.94 billion depending on how fast Taipower connects new load (DC Market Insights estimate).
USD 1.23 billion of 2025 spend on the physical layers that carry IT load: electrical power trains, cooling plant, civil and structural works, racks and cabling. Servers, storage, switches, land, electricity and DCIM software are excluded.
Electrical Infrastructure leads with USD 457.29 million in 2025, 37.1% of the market, because AI halls need about USD 5.00 million of switchgear, UPS systems and busway per MW.
Upgrades and Retrofits grow fastest at 17.26% a year, from USD 152.19 million in 2025 to USD 748.14 million in 2035, as older Taipei-area halls are re-equipped for denser AI racks.
USD 9.75 million per MW of IT load for a conventional hall and USD 13.35 million for an AI hall in 2025, DC Market Insights estimates, rising about 2% a year.
Southern Taiwan grows fastest at 17.99% a year, from USD 234.14 million in 2025 to USD 1.22 billion in 2035, led by science-park AI compute in Tainan and Kaohsiung.
The top five suppliers hold about 41% of 2025 power and cooling equipment value; Delta Electronics leads with about 11%, followed by Schneider Electric, Vertiv, ABB and Eaton (DC Market Insights estimate).
Scope. DC Market Insights counts USD 1.66 billion in 2026 for power, cooling, construction, racks and cabling only; broader definitions add servers, storage, switches, DCIM software or exported equipment.
USD 1.23 billion in 2025 covers the hardware and construction that DCIM software monitors; the software itself is sized separately in the Taiwan Data Center Infrastructure Management (DCIM) Market report.
Get this report
How do I get the full report?
Request a quote; we reply by email within one business day.
How and when will I receive the report?
By email, within 24–48 business hours of payment.
How can I pay?
Once you accept the quote, we email you a secure payment link.
Can I see a sample first?
Yes. Request a free sample and we will email it to you.
Can the report be tailored to my needs?
Yes. We can add countries, segments or data cuts. Talk to an analyst about the scope you need.
Can I get an invoice or pay against a purchase order?
Write to sales@dcmarketinsights.com and our team will help.