
Gaming Data Center Market Size, Share & Forecast to 2035
Market at a glance
The Gaming Data Center market was worth USD 3,620.0 million in 2025 and is forecast to reach USD 9,650.0 million by 2035, growing at a 10.32% CAGR.
 By Amit Jain, Senior Consultant, ICT & Emerging Technologies
 Reviewed by Deepti Agrawal
Last updated 9 Nov 2026
Base year 2025 PDF + Excel
Key findings
30.6 Million Simultaneous Roblox Players Force Peak-Sized Fleets
Edge Game Servers within Milliseconds of Players
GPU Capacity for AI-Driven Games
What is inside the report
- 01Introduction
- 02Executive Summary
- 03Market Scope
- 04Why Market Estimates Differ
- 05Market Drivers
- 06Market Trends
- 07Market Challenges and Restraints
- 08Market Opportunities
- 09Pricing Analysis
- 10Standards and Regulation
- 18chapters
- 2020-2024Historical period
- 2026-2035Forecast period
- —Companies profiled
Segmentation
Recent developments
Microsoft reported that Xbox content and services revenue decreased 10% in the quarter to 30 June 2026 (Source: Microsoft)
NVIDIA announced a new RTX 5080-powered GeForce NOW server in Toronto (Source: NVIDIA)
Roblox reported more than 400 AI models running at over 1.5 million inferences per second (Source: Roblox)
Roblox reported more than 150,000 servers in 25 regional data centers (Source: Roblox)
Xbox Cloud Gaming launched in India, Brazil and Argentina, reaching 29 countries (Source: Microsoft)
Roblox peak concurrent players reached 30.6 million, more than double April's 13.9 million (Source: Roblox)
Full analysis
The Gaming Data Center Market is valued at USD 4.10 billion in 2026 and is projected to reach USD 9.65 billion by 2035, up from USD 3.62 billion in 2025, a CAGR of 10.32% from 2025 to 2035 (DC Market Insights estimate). Money in this market follows peak concurrent players, not average users: Roblox sized its fleet for a jump from 13.9 million to 30.6 million simultaneous players between April and June 2025 (Roblox, June 2025) and now runs more than 150,000 servers in 25 regional data centers (Roblox annual report on Form 10-K, February 2026). Game companies must hold that peak capacity all year, which is why USD 1,138.46 million of 2025 spending sits in owned halls and another USD 568.23 million in colocation and edge sites close to players. The 2025 value rests on 675 megawatts (MW) of information technology (IT) load used by game companies x USD 5.36 million of yearly spending per MW = USD 3.62 billion. AI and player analytics is the fastest workload at 18.23% a year because moderation, translation and matchmaking models now run on every session, and Latin America is the fastest region at 12.55% as cloud gaming regions open in Brazil and Argentina.
Key Market Statistics: How Much Do Game Companies Spend on Data Centers in 2026?
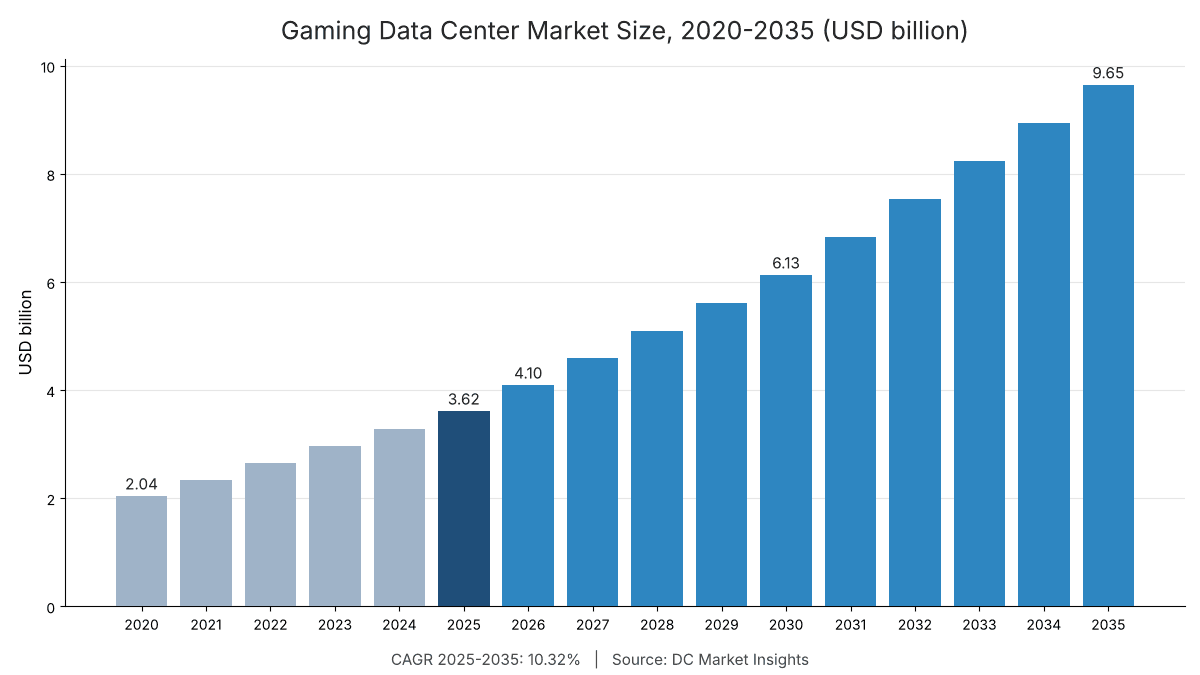
DC Market Insights puts gaming data center spending at USD 4.10 billion in 2026, 13.32% above 2025, as game platforms add GPU capacity for AI models and cloud gaming services add regions.
- Gaming data center market size 2025: USD 3.62 billion
- Market size 2026: USD 4.10 billion
- Market size 2030: USD 6.13 billion
- Market size 2035: USD 9.65 billion
- CAGR 2025-2035: 10.32% (low case 8.41%, high case 11.87%)
- Largest component: cloud infrastructure services, USD 1.91 billion or 52.8% of 2025 value
- Largest workload: game servers and live services, USD 1.37 billion in 2025; fastest workload: AI and player analytics at 18.23%
- Fastest end user: cloud gaming services at 14.88% a year to USD 1.45 billion by 2035
- Leading region: Asia Pacific, USD 1.45 billion or 40.0% of 2025 value; fastest region: Latin America at 12.55%
- Largest country: United States, USD 1.01 billion in 2025; fastest large country: India at 18.23%
- Market leaders: Amazon Web Services, Microsoft Azure, Google Cloud, Tencent Cloud and Alibaba Cloud in hosted capacity, with NVIDIA, Supermicro, Dell Technologies and Hewlett Packard Enterprise in owned game servers (DC Market Insights assessment)
Executive Summary: Gaming Data Center Market Size, 2020-2035
The Global Gaming Data Center Market size was valued at USD 2.04 billion in 2020, reached USD 3.62 billion in 2025, and is anticipated to reach USD 9.65 billion by 2035, at a CAGR of 10.32% during the forecast period. Spending grew 12.07% a year from 2020 to 2025, when always-online play and user-generated game platforms scaled; from 2025 graphics processing unit (GPU) capacity rises from 67 MW to 420 MW, and each GPU MW costs about three times a conventional game-server MW to run.
| Attribute | Value |
|---|---|
| Historical period | 2020-2024 |
| Base year | 2025 |
| Forecast period | 2026-2035 |
| Market size 2025 | USD 3.62 billion |
| Market size 2026 | USD 4.10 billion |
| CAGR 2025-2035 | 10.32% |
| Market size 2035 | USD 9.65 billion |
| Segments covered | Component, deployment model, workload, end user, region, 12 countries |
Public cloud spending by game companies rises from USD 1.91 billion to USD 5.40 billion, while colocation and edge hosting grows fastest at 11.59% a year. The chart shows the DC Market Insights series year by year.
What Counts as a Gaming Data Center?
USD 3.62 billion in 2025: the data center capacity that game publishers, game and user-generated content (UGC) platforms, cloud gaming services and esports operators own, colocate or rent from cloud providers to run their games.
Included: public cloud infrastructure that game companies pay for (USD 1.91 billion); game servers, GPU servers, storage and networking in owned and colocated sites (USD 1.24 billion); colocation and edge hosting fees (USD 230.72 million); power and cooling equipment in owned sites (USD 148.42 million); and construction and fit-out (USD 87.70 million). Multiplayer and matchmaking servers, cloud game streaming GPUs, patch and download delivery, build farms, player analytics, AI models and storefront IT all count.
Excluded: consoles, gaming PCs and phones, the telecom and content delivery networks that carry traffic for all industries, gambling and betting platforms, game engine software licences, and game development salaries.
How the segments fit together: every split (component, deployment model, workload, end user, region) sums to USD 3.62 billion in 2025 and USD 9.65 billion in 2035. The model counts 675 MW in use in 2025: 297 MW owned, 101 MW colocated and 277 MW in public cloud, of which 67 MW is GPU capacity and 229 MW sits at edge sites within a few milliseconds of players.
Why Do Gaming Data Center Market Estimates Differ?
Published figures differ because some studies count gaming hardware or all cloud revenue from game companies; the DC Market Insights value of USD 4.10 billion in 2026 counts only the data center capacity game companies use.
Broader definitions add three things. First, gaming servers and GPUs sold to all buyers, including consumer gaming PCs, which belong to hardware markets. Second, the full content delivery network (CDN) traffic bill of the internet, not only game downloads. Third, the wider media industry: game spending here is exactly the video games and interactive entertainment end user of the Media and Entertainment Data Center Market report (USD 3,615.20 million in 2025 and USD 9,650.28 million in 2035), so the two DC Market Insights reports reconcile. Independent studios and small mobile publishers are in scope, mostly through cloud spending.
| Element | In the DC Market Insights estimate | Why |
|---|---|---|
| Public cloud capacity rented by game companies | Yes, USD 1.91 billion (2025) | Capacity the company pays for |
| Game servers, GPUs, storage in owned or colocated sites | Yes, USD 1.24 billion | Capacity the company buys and runs |
| Colocation, power, cooling and construction | Yes, USD 466.84 million | Facility layer of that capacity |
| Consoles, gaming PCs and phones | No | Consumer devices, not data centers |
| CDN and telecom capacity sold to all industries | No, unless run by a game company | Belongs to network services |
| Game engine licences and studio salaries | No | Not data center capacity |
Market Drivers: Why Are Game Companies Adding Data Center Capacity?
Three gaming-specific drivers lift spending from USD 3.62 billion in 2025 to USD 6.13 billion in 2030: record concurrent-player peaks, cloud gaming regions, and AI models inside live games.
30.6 Million Simultaneous Roblox Players Force Peak-Sized Fleets
Roblox peak concurrent players more than doubled from 13.9 million in April 2025 to 30.6 million in June 2025 (Roblox, June 2025). Its infrastructure and trust and safety expense rose 26% to USD 1.15 billion in 2025, with USD 186.3 million of the increase coming from data center and technical infrastructure, and spending on property and equipment rose from USD 179.6 million to USD 441.0 million (Roblox, February 2026). Game servers and live services are the largest workload at USD 1.37 billion in 2025.
Xbox Cloud Gaming Reaches 29 Countries with 45% More Hours
Microsoft took Xbox Cloud Gaming to India, Brazil and Argentina in November 2025, bringing it to 29 countries, and cloud gaming hours rose 45% year on year (Microsoft, November 2025). Each new country needs GPU servers in or near it, because streamed play breaks above a few tens of milliseconds. Cloud game streaming is a USD 325.37 million workload in 2025 and grows 16.10% a year.
400 AI Models Run Inside One Game Platform
Roblox operates more than 400 AI models at over 1.5 million inferences per second on on-premise and public cloud GPUs (Roblox, May 2026), covering safety, voice and chat moderation, translation and recommendations. AI and player analytics grows from USD 433.82 million in 2025 to USD 2.32 billion in 2035, the fastest workload; inference capacity overlaps with the AI Inference Data Center Market report.
Market Trends: How Is Game Infrastructure Changing?
Game companies are moving servers closer to players and onto GPUs: edge capacity rises from 229 MW in 2025 to 591 MW in 2035.
Edge Game Servers within Milliseconds of Players
Roblox engineers manage 24 edge data centers that run the game servers, plus two core data centers (Roblox, June 2025), and the company operates sites in eight U.S. states and 11 other countries (Roblox, February 2026). Colocation and edge hosting is the fastest deployment model at 11.59% a year; the hardware overlaps with the Edge Server Market report.
Cloud Gaming Fleets Refresh to New GPU Generations
NVIDIA had moved almost every GeForce NOW region to RTX 5080-class servers by November 2025, with Stockholm the last region (NVIDIA, November 2025), and announced a new RTX 5080 server in Toronto in July 2026 (NVIDIA, July 2026). Refresh cycles of three to four years keep cloud gaming services the fastest end user at 14.88% a year.
Publishers Rent More and Own Less
Electronic Arts states that many of its critical applications reside in only one of its data centers (Electronic Arts, May 2026), a resilience gap that pushes publishers towards multi-region cloud. Public cloud rises from 52.8% of 2025 value to 56.0% in 2035 in the DC Market Insights model.
Market Challenges and Restraints: What Slows Gaming Data Center Spending?
Two limits hold growth to 10.32% a year: weaker console revenues and energy reporting rules on European sites.
Xbox Content and Services Revenue Falls 10%
Microsoft reported that Xbox content and services revenue decreased 10% in the quarter to 30 June 2026 (Microsoft, July 2026). Console and PC publishers cut fixed costs when revenue falls, so they grow only 8.75% a year and their share falls from 30.0% in 2025 to 26.0% in 2035.
EU Energy Reporting Raises the Cost of Owned Sites
European data centers used 68 terawatt-hours (TWh) in 2024 and are projected to use 114 TWh by 2030, 3.2% of EU electricity demand, according to the European Commission’s draft rating scheme of September 2026 (European Commission, September 2026). Game companies with owned sites of 500 kilowatts (kW) or more report energy and water data each year, so owned-site electrical and mechanical spending grows only 5.94% a year.
Market Opportunities: Where Is New Gaming Compute Demand?
Two pools add USD 3.00 billion of yearly spending between 2025 and 2035: AI models in games and cloud gaming in new countries.
GPU Capacity for AI-Driven Games
GPU capacity used by game companies rises from 67 MW in 2025 to 420 MW in 2035 in the DC Market Insights model, as safety, voice, translation and generative creation tools run on every session. Game platforms and UGC platforms grow 11.62% a year to USD 2.61 billion.
Cloud Gaming in India and Latin America
India grows 18.23% a year to USD 386.01 million by 2035 and Latin America 12.55% to USD 530.77 million, following the Xbox Cloud Gaming launches in India, Brazil and Argentina (Microsoft, November 2025). Players there use phones and low-cost devices, so streamed play needs local GPU regions or colocation space; see the Data Center Colocation Market report.
How Much Does Gaming Data Center Capacity Cost per MW?
USD 5.36 million of yearly spending per MW in use in 2025, DC Market Insights estimates, rising to USD 6.21 million by 2035 as GPU capacity grows from 10% to 27% of gaming MW.
| Year | IT load in use (MW) | Spending per MW | Cloud rate, conventional (USD per kW-month) | Cloud rate, GPU (USD per kW-month) | Colocation rate (USD per kW-month) |
|---|---|---|---|---|---|
| 2020 | 430 | USD 4.76 million | USD 526 | USD 1,456 | USD 181 |
| 2025 | 675 | USD 5.36 million | USD 500 | USD 1,250 | USD 190 |
| 2030 | 1,024 | USD 5.99 million | USD 475 | USD 1,073 | USD 200 |
| 2035 | 1,555 | USD 6.21 million | USD 452 | USD 922 | USD 210 |
Public anchors: Roblox spent USD 441.0 million on property and equipment in 2025 for a fleet of more than 150,000 servers (Roblox, February 2026). In the DC Market Insights model a game company pays about USD 500 per kW-month for conventional cloud capacity in 2025 and USD 1,250 for GPU capacity, against USD 190 for colocation space and power, which is why platforms with steady player loads keep game servers in owned or colocated halls.
Which Rules Shape Where Game Companies Run Their Servers?
Four European rules set the terms for USD 686.89 million of 2025 European gaming data center spending and for global publishers that serve European players.
- EU Data Act, Regulation (EU) 2023/2854: applies from 12 September 2025; cloud switching charges are abolished from January 2027, which lowers the cost of moving game backends between providers (Source: European Union)
- Commission Delegated Regulation (EU) 2024/1364: data centers of 500 kW and more report energy and water indicators, first by 15 September 2024, then each 15 May (Source: European Commission)
- EU data center rating scheme, draft C(2026) 3472: labels due by 15 August 2027 (Source: European Commission)
- EU AI Act: obligations for general-purpose AI models apply from 2 August 2025, relevant to generative tools that game platforms build into creation and moderation (Source: European Commission)
Gaming Data Center Market Segmentation: Which Segment Spends Most?
Cloud infrastructure services lead components at USD 1.91 billion in 2025, game servers and live services lead workloads at USD 1.37 billion, and console and PC publishers lead end users at USD 1.08 billion.
By Component
Cloud infrastructure services hold 52.8% of 2025 value and grow fastest at 10.96% a year.
| Component | 2025 (USD million) | Share 2025 | 2035 (USD million) | CAGR 2025-2035 |
|---|---|---|---|---|
| Cloud Infrastructure Services | USD 1,908.51 million | 52.8% | USD 5,401.75 million | 10.96% |
| IT Hardware | USD 1,239.85 million | 34.3% | USD 3,155.45 million | 9.79% |
| Colocation Services | USD 230.72 million | 6.4% | USD 626.60 million | 10.51% |
| Electrical and Mechanical Infrastructure | USD 148.42 million | 4.1% | USD 264.34 million | 5.94% |
| Construction and Fit-Out | USD 87.70 million | 2.4% | USD 202.14 million | 8.71% |
By Deployment Model
Owned data centers hold 31.5% of 2025 value; colocation and edge hosting grows fastest at 11.59%.
| Deployment Model | 2025 (USD million) | Share 2025 | 2035 (USD million) | CAGR 2025-2035 |
|---|---|---|---|---|
| Public Cloud | USD 1,908.51 million | 52.8% | USD 5,401.75 million | 10.96% |
| Owned Data Centers | USD 1,138.46 million | 31.5% | USD 2,547.51 million | 8.39% |
| Colocation and Edge Hosting | USD 568.23 million | 15.7% | USD 1,701.03 million | 11.59% |
By Workload
AI and player analytics grows fastest at 18.23% a year, and cloud game streaming at 16.10%.
| Workload | 2025 (USD million) | Share 2025 | 2035 (USD million) | CAGR 2025-2035 |
|---|---|---|---|---|
| Game Servers and Live Services | USD 1,373.78 million | 38.0% | USD 2,895.08 million | 7.74% |
| Content Delivery and Patch Distribution | USD 614.58 million | 17.0% | USD 1,158.03 million | 6.54% |
| Game Development and Build Pipelines | USD 506.13 million | 14.0% | USD 1,061.53 million | 7.69% |
| AI and Player Analytics | USD 433.82 million | 12.0% | USD 2,316.07 million | 18.23% |
| Corporate IT and Storefronts | USD 361.52 million | 10.0% | USD 772.02 million | 7.88% |
| Cloud Game Streaming | USD 325.37 million | 9.0% | USD 1,447.54 million | 16.10% |
By End User
Console and PC publishers spend USD 1.08 billion in 2025, ahead of mobile game publishers at USD 1.01 billion; cloud gaming services grow fastest.
| End User | 2025 (USD million) | Share 2025 | 2035 (USD million) | CAGR 2025-2035 |
|---|---|---|---|---|
| Console and PC Publishers | USD 1,084.56 million | 30.0% | USD 2,509.07 million | 8.75% |
| Mobile Game Publishers | USD 1,012.26 million | 28.0% | USD 2,412.57 million | 9.07% |
| Game Platforms and UGC Platforms | USD 867.65 million | 24.0% | USD 2,605.58 million | 11.62% |
| Cloud Gaming Services | USD 361.52 million | 10.0% | USD 1,447.54 million | 14.88% |
| Esports and Other Interactive Services | USD 289.22 million | 8.0% | USD 675.52 million | 8.85% |
DC Exclusive: Roblox Peak-Player Server Teardown, 30.6 Million Players on 150,000 Servers
This DC Market Insights model breaks down what it costs one game platform to hold peak capacity, built on 8 inputs from Roblox filings and company pages. It shows about 204 peak concurrent players per server and USD 37.70 of yearly infrastructure and trust and safety expense per peak player.
| Item | Value | How it is derived | Source date |
|---|---|---|---|
| Peak concurrent players | 30.6 million | Reported peak, June 2025 | Jun 2025 |
| Servers in the Roblox Cloud | 150,000+ | Reported, 31 Dec 2025 | Feb 2026 |
| Sites | 25 regional data centers (24 edge + 2 core reported in 2025) | Reported | Jun 2025 / Feb 2026 |
| Peak players per server | about 204 | 30.6 million / 150,000 | DC Market Insights |
| Servers per site | about 5,769 | 150,000 / 26 sites | DC Market Insights |
| Infrastructure and trust and safety expense | USD 1,153.5 million | Reported, 2025 | Feb 2026 |
| Expense per server-year | about USD 7,690 | USD 1,153.5 million / 150,000 | DC Market Insights |
| Expense per peak player-year | USD 37.70 | USD 1,153.5 million / 30.6 million | DC Market Insights |
| Property and equipment per peak player | USD 14.41 | USD 441.0 million / 30.6 million | DC Market Insights |
| AI inference load | 1.5 million inferences per second, 400+ models | Reported | May 2026 |
Reading the teardown: a game platform pays for its peak, not its average, so each extra million concurrent players adds roughly 4,900 servers at the June 2025 density. DC Market Insights uses this ratio to check the game-server line of USD 1.37 billion in 2025: the expense figure also includes trust and safety staff, so it is an upper bound for one company’s data center cost.
Which Region Spends Most on Gaming Data Centers?
Asia Pacific leads with USD 1.45 billion, 40.0% of 2025 value, and Latin America grows fastest at 12.55% a year to USD 530.77 million by 2035.
| Region | 2025 (USD million) | Share 2025 | 2035 (USD million) | CAGR 2025-2035 |
|---|---|---|---|---|
| Asia Pacific | USD 1,446.08 million | 40.0% | USD 4,149.62 million | 11.12% |
| North America | USD 1,193.02 million | 33.0% | USD 2,846.83 million | 9.09% |
| Europe | USD 686.89 million | 19.0% | USD 1,737.05 million | 9.72% |
| Latin America | USD 162.68 million | 4.5% | USD 530.77 million | 12.55% |
| Middle East and Africa | USD 126.53 million | 3.5% | USD 386.01 million | 11.80% |
Asia Pacific
Asia Pacific spends USD 1.45 billion in 2025 and grows 11.12% a year. China, Japan and South Korea host the largest mobile and PC game publishers, and India adds players fastest at 18.23% a year after the Xbox Cloud Gaming launch of November 2025.
North America
North America spends USD 1.19 billion in 2025 and grows 9.09% a year. Roblox runs data centers in Florida, Georgia, Illinois, New Jersey, Texas, Virginia, California and Washington (Roblox, February 2026).
Europe
Europe spends USD 686.89 million in 2025 and grows 9.72% a year; GeForce NOW completed its RTX 5080 upgrade with Stockholm in late 2025 (NVIDIA, November 2025), and EU energy reporting shapes where owned sites are built.
Latin America
Latin America spends USD 162.68 million in 2025 and grows 12.55% a year, the fastest region, after Xbox Cloud Gaming opened in Brazil and Argentina in November 2025 (Microsoft, November 2025).
Middle East and Africa
Middle East and Africa spends USD 126.53 million in 2025 and grows 11.80% a year; Saudi Arabia is the largest country in the region at USD 43.38 million.
Top 12 Countries in the Gaming Data Center Market
The United States is the largest country at USD 1.01 billion in 2025, 28.0% of the global total; India is the fastest large country at 18.23% a year.
| Rank | Country | Region | 2025 (USD million) | Share 2025 | 2035 (USD million) | CAGR 2025-2035 |
|---|---|---|---|---|---|---|
| 1 | United States | North America | USD 1,012.26 million | 28.0% | USD 2,412.57 million | 9.07% |
| 2 | China | Asia Pacific | USD 650.74 million | 18.0% | USD 1,881.80 million | 11.20% |
| 3 | Japan | Asia Pacific | USD 253.06 million | 7.0% | USD 627.27 million | 9.50% |
| 4 | South Korea | Asia Pacific | USD 216.91 million | 6.0% | USD 579.02 million | 10.32% |
| 5 | United Kingdom | Europe | USD 144.61 million | 4.0% | USD 347.41 million | 9.16% |
| 6 | Germany | Europe | USD 126.53 million | 3.5% | USD 308.81 million | 9.33% |
| 7 | Canada | North America | USD 108.46 million | 3.0% | USD 250.91 million | 8.75% |
| 8 | France | Europe | USD 90.38 million | 2.5% | USD 221.96 million | 9.40% |
| 9 | Brazil | Latin America | USD 72.30 million | 2.0% | USD 250.91 million | 13.25% |
| 10 | India | Asia Pacific | USD 72.30 million | 2.0% | USD 386.01 million | 18.23% |
| 11 | Australia | Asia Pacific | USD 54.23 million | 1.5% | USD 144.75 million | 10.32% |
| 12 | Saudi Arabia | Middle East and Africa | USD 43.38 million | 1.2% | USD 173.71 million | 14.88% |
Forecast Scenarios: How Large Could the Gaming Data Center Market Be in 2035?
Between USD 8.11 billion and USD 11.10 billion in 2035, with USD 9.65 billion as the DC Market Insights base case.
| Scenario | 2035 (USD million) | CAGR 2025-2035 | What it assumes |
|---|---|---|---|
| Low | USD 8,106.24 million | 8.41% | Gaming IT load 16% lower in 2035; slower cloud gaming roll-out |
| Base | USD 9,650.28 million | 10.32% | 1,555 MW in 2035, GPU share 27% |
| High | USD 11,097.82 million | 11.87% | Gaming IT load 15% higher; AI creation tools on most sessions |
Low Scenario
USD 8.11 billion in 2035 if console revenues keep falling and cloud gaming stays a niche outside North America and Europe.
Base Scenario
USD 9.65 billion in 2035, with gaming IT load rising from 675 MW to 1,555 MW and GPU capacity to 27% of it.
High Scenario
USD 11.10 billion in 2035 if generative creation tools and streamed play reach most players in Asia Pacific and Latin America.
Key Players and Market Share: Who Supplies Gaming Data Centers?
Amazon Web Services, Microsoft Azure, Google Cloud, Tencent Cloud and Alibaba Cloud together take about 75% of the USD 1.91 billion of 2025 gaming cloud infrastructure spending (DC Market Insights estimate); owned game servers come mainly from Supermicro, Dell Technologies, Hewlett Packard Enterprise and Lenovo, with NVIDIA and AMD supplying the GPUs.
- Amazon Web Services
- Microsoft Azure
- Google Cloud
- Tencent Cloud
- Alibaba Cloud
- Oracle Cloud Infrastructure
- Akamai Technologies
- Equinix
- Digital Realty
- NVIDIA
- AMD
- Supermicro
- Dell Technologies
- Hewlett Packard Enterprise
- Lenovo
- Vertiv
Company facts: Roblox keeps the majority of its services in data centers it manages and uses Amazon Web Services for some storage and bursting (Roblox, February 2026). Microsoft runs Xbox Cloud Gaming on its own server capacity in 29 countries (Microsoft, November 2025). NVIDIA operates GeForce NOW as its own service on RTX 5080-class servers (NVIDIA, November 2025).
Cloud Provider Concentration, 2025
Western publishers buy mainly from Amazon Web Services, Microsoft Azure and Google Cloud, while Chinese publishers buy from Tencent Cloud and Alibaba Cloud, so the top five hold most gaming cloud spending. DC Market Insights estimates their combined share at about 75% and expects it to stay above 70% to 2030.
Recent Developments in the Gaming Data Center Market
Six dated events since June 2025 shaped the 2026 outlook of USD 4.10 billion.
- In July 2026, Microsoft reported that Xbox content and services revenue decreased 10% in the quarter to 30 June 2026 (Source: Microsoft)
- In July 2026, NVIDIA announced a new RTX 5080-powered GeForce NOW server in Toronto (Source: NVIDIA)
- In May 2026, Roblox reported more than 400 AI models running at over 1.5 million inferences per second (Source: Roblox)
- In February 2026, Roblox reported more than 150,000 servers in 25 regional data centers (Source: Roblox)
- In November 2025, Xbox Cloud Gaming launched in India, Brazil and Argentina, reaching 29 countries (Source: Microsoft)
- In June 2025, Roblox peak concurrent players reached 30.6 million, more than double April’s 13.9 million (Source: Roblox)
Research Methodology: How DC Market Insights Sized the Gaming Data Center Market
The USD 3.62 billion 2025 value is a bottom-up DC Market Insights model of 675 MW of gaming IT load in use, priced component by component and reconciled with the gaming end user of the Media and Entertainment Data Center Market; see the DC Market Insights research methodology.
Model Inputs
Gaming IT load in use of 430, 675, 1,024 and 1,555 MW in 2020, 2025, 2030 and 2035; owned share 52%, 44%, 38% and 34%; colocated share 14%, 15%, 16% and 16%; public cloud the rest; GPU share 4%, 10%, 20% and 27%; edge share 30%, 34%, 37% and 38%. In 2025 servers cost USD 2.55 million per conventional MW-year and USD 8.20 million per GPU MW-year; cloud capacity USD 6.00 million and USD 15.00 million per MW-year; colocation USD 190 per kW-month, so 101.2 MW x USD 190 x 12 = USD 230.72 million. Owned-site electrical and mechanical spending is USD 0.50 million per owned MW-year and construction USD 0.13 million per MW in use.
Bound Checks
Ceiling 1: USD 3.62 billion is about 0.6% of the DC Market Insights global data center market of USD 570.04 billion in 2025. Ceiling 2: the value equals 31.0% of the USD 11.66 billion Media and Entertainment Data Center Market, the same share as gaming’s end-user row there. Floor: Roblox alone spent USD 441.0 million on property and equipment in 2025 and added USD 186.3 million of data center and technical infrastructure expense, USD 627.3 million together, well inside the USD 1.71 billion of owned and colocated gaming spending.
Table of contents
- 01Introduction
- 1.1Report Description
- 1.2Key Market Statistics, 2025, 2026, 2030 and 2035
- 02Executive Summary
- 2.1Market Snapshot, 2025, 2026 and 2035
- 2.2Market Size Chart, 2020-2035
- 03Market Scope
- 3.1Included
- 3.2Excluded
- 3.3How the Segments Fit Together
- 04Why Market Estimates Differ
- 4.1Scope Table: In and Out of the DC Market Insights Estimate
- 05Market Drivers
- 5.130.6 Million Simultaneous Roblox Players Force Peak-Sized Fleets
- 5.2Xbox Cloud Gaming Reaches 29 Countries with 45% More Hours
- 5.3400 AI Models Run Inside One Game Platform
- 06Market Trends
- 6.1Edge Game Servers within Milliseconds of Players
- 6.2Cloud Gaming Fleets Refresh to New GPU Generations
- 6.3Publishers Rent More and Own Less
- 07Market Challenges and Restraints
- 7.1Xbox Content and Services Revenue Falls 10%
- 7.2EU Energy Reporting Raises the Cost of Owned Sites
- 08Market Opportunities
- 8.1GPU Capacity for AI-Driven Games
- 8.2Cloud Gaming in India and Latin America
- 09Pricing Analysis
- 9.1Spending per MW, 2020-2035
- 9.2Public Price Anchors
- 10Standards and Regulation
- 10.1EU Data Act, Regulation (EU) 2023/2854
- 10.2Delegated Regulation (EU) 2024/1364
- 10.3EU Data Center Rating Scheme
- 10.4EU AI Act
- 11Market Segmentation
- 11.1By Component
- 11.2Cloud Infrastructure Services
- 11.3IT Hardware
- 11.4Colocation Services
- 11.5Electrical and Mechanical Infrastructure
- 11.6Construction and Fit-Out
- 11.7By Deployment Model
- 11.8Public Cloud
- 11.9Owned Data Centers
- 11.10Colocation and Edge Hosting
- 11.11By Workload
- 11.12Game Servers and Live Services
- 11.13Content Delivery and Patch Distribution
- 11.14Game Development and Build Pipelines
- 11.15AI and Player Analytics
- 11.16Corporate IT and Storefronts
- 11.17Cloud Game Streaming
- 11.18By End User
- 11.19Console and PC Publishers
- 11.20Mobile Game Publishers
- 11.21Game Platforms and UGC Platforms
- 11.22Cloud Gaming Services
- 11.23Esports and Other Interactive Services
- 12DC Exclusive: Roblox Peak-Player Server Teardown
- 12.1Peak Players per Server
- 12.2Expense per Server-Year and per Peak Player
- 12.3AI Inference Load
- 13Regional Insights
- 13.1Asia Pacific
- 13.2North America
- 13.3Europe
- 13.4Latin America
- 13.5Middle East and Africa
- 14Country Analysis
- 14.1United States
- 14.2China
- 14.3Japan
- 14.4South Korea
- 14.5United Kingdom
- 14.6Germany
- 14.7Canada
- 14.8France
- 14.9Brazil
- 14.10India
- 14.11Australia
- 14.12Saudi Arabia
- 15Forecast Scenarios
- 15.1Low Scenario
- 15.2Base Scenario
- 15.3High Scenario
- 16Competitive Insights
- 16.1Cloud Provider Concentration, 2025
- 16.2Amazon Web Services
- 16.3Microsoft Azure
- 16.4Google Cloud
- 16.5Tencent Cloud
- 16.6Alibaba Cloud
- 16.7Oracle Cloud Infrastructure
- 16.8Akamai Technologies
- 16.9Equinix
- 16.10Digital Realty
- 16.11NVIDIA
- 16.12AMD
- 16.13Supermicro
- 16.14Dell Technologies
- 16.15Hewlett Packard Enterprise
- 16.16Lenovo
- 16.17Vertiv
- 17Recent Developments
- 17.1Dated Events, June 2025 to July 2026
- 18Research Methodology
- 18.1Model Inputs
- 18.2Bound Checks
- Fig. 1Gaming Data Center Market Size, 2020-2035
- Table 1Executive Summary Attributes
- Table 2Scope Table: In and Out of the Estimate
- Table 3Spending per MW, 2020-2035
- Table 4Market by Component, 2025 and 2035
- Table 5Market by Deployment Model, 2025 and 2035
- Table 6Market by Workload, 2025 and 2035
- Table 7Market by End User, 2025 and 2035
- Table 8Roblox Peak-Player Server Teardown
- Table 9Market by Region, 2025 and 2035
- Table 10Top 12 Countries, 2025 and 2035
- Table 11Forecast Scenarios, 2035
About this report
Written by Amit Jain and reviewed by Deepti Agrawal, Senior Editor, Research. Figures are built top-down and bottom-up and reconciled before publication, with 2025 as the base year.
Read our methodologyHow we built this
- Historical period2020-2024
- Base year2025
- Forecast period2026-2035
- Sizing approachTop-down + bottom-up
Need more than the report?
Advisory on this market
Due diligence, site selection and market entry work, by the analysts who wrote this report.
See consulting servicesFrequently asked questions
USD 4.10 billion in 2026, up 13.32% from USD 3.62 billion in 2025, according to DC Market Insights estimates. The market is projected to reach USD 9.65 billion by 2035, a CAGR of 10.32% from 2025.
10.32% a year from 2025 to 2035, after 12.07% a year from 2020 to 2025, as gaming IT load in use rises from 675 MW to 1,555 MW and GPU capacity climbs from 10% to 27% of it.
USD 3.62 billion in 2025 was spent on capacity that game publishers, game platforms, cloud gaming services and esports operators own, colocate or rent from cloud providers: game servers, streaming GPUs, patch delivery, build farms, analytics and AI. Consoles and PCs are not counted.
150,000+ servers in 25 regional data centers at the end of 2025, according to its 10-K, with 24 edge sites running game servers. Roblox spent USD 441.0 million on property and equipment in 2025, up from USD 179.6 million.
About 204 peak concurrent players per server at Roblox in 2025, DC Market Insights estimates: 30.6 million peak players on more than 150,000 servers, or about USD 37.70 of infrastructure and trust and safety expense per peak player a year.
AI and player analytics grows fastest at 18.23% a year to USD 2.32 billion by 2035; cloud game streaming follows at 16.10%, and cloud gaming services lead end users at 14.88%.
Asia Pacific, with USD 1.45 billion or 40.0% of 2025 value. Latin America grows fastest at 12.55% a year, and India is the fastest large country at 18.23%.
52.8% of 2025 spending, USD 1.91 billion, goes to public cloud and 31.5% to owned data centers. Platforms with steady player loads, such as Roblox, keep most game servers in halls they manage.
USD 5.36 million of yearly spending per MW in use in 2025, DC Market Insights estimates. GPU cloud capacity costs about USD 1,250 per kW-month, conventional cloud USD 500 and colocation USD 190.
USD 4.10 billion in 2026 counts only data center capacity that game companies use. Estimates that add consoles, gaming PCs, all CDN traffic or game software come out larger; this value matches the gaming row of the DC Market Insights media and entertainment report.
Get this report
How do I get the full report?
Request a quote; we reply by email within one business day.
How and when will I receive the report?
By email, within 24–48 business hours of payment.
How can I pay?
Once you accept the quote, we email you a secure payment link.
Can I see a sample first?
Yes. Request a free sample and we will email it to you.
Can the report be tailored to my needs?
Yes. We can add countries, segments or data cuts. Talk to an analyst about the scope you need.
Can I get an invoice or pay against a purchase order?
Write to sales@dcmarketinsights.com and our team will help.