
AI Inference Data Center Market Size, Share & Forecast to 2035
Market at a glance
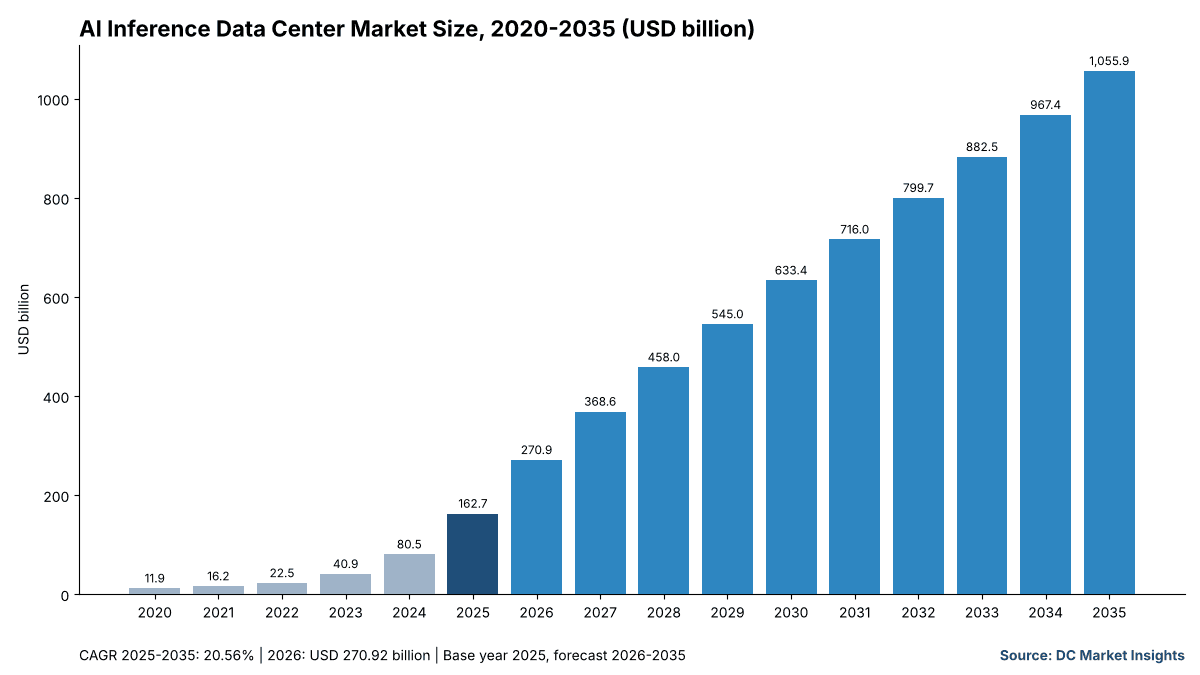
The AI Inference Data Center market was worth USD 162.71 billion in 2025 and is forecast to reach USD 1,055.87 billion by 2035, growing at a 20.56% CAGR.
 By Amit Jain, Senior Consultant, ICT & Emerging Technologies
 Reviewed by Deepti Agrawal
Last updated 6 Nov 2026
Base year 2025 PDF + Excel
Key findings
Google's First-Party APIs Reached 32 Billion Tokens per Minute
Prefill and Decode Split Into Separate Racks
Grid Capacity: 6.7-12% of US Electricity by 2028
Edge Inference Sites: USD 6.51 billion to USD 105.59 billion
What is inside the report
- 01Introduction
- 02Executive Summary
- 03Market Dynamics
- 04Pricing Analysis
- 05Standards and Regulation
- 06Market Segmentation by Spend Layer
- 07Market Segmentation by Operator Type
- 08Market Segmentation by Accelerator Type
- 09Market Segmentation by Application
- 10DC Exclusive: Token-to-Megawatt Bridge
- 16chapters
- 2020-2024Historical period
- 2026-2035Forecast period
- —Companies profiled
Segmentation
Recent developments
Google said its first-party model APIs were processing nearly 32 billion tokens per minute (Source: Alphabet Q3 2026 results, Google).
Amazon said inference accounts for well over half of AWS AI revenue and Trainium commitments rose more than 20 times year on year (Source: Amazon).
NVIDIA said its Groq 3 LPX decode rack was in full production, with Nebius as the first adopter (Source: NVIDIA).
Groq opened a European inference site in Helsinki with Equinix (Source: Groq).
Google introduced Ironwood, its first TPU designed for inference (Source: Google).
Saudi Arabia committed USD 1.5 billion to expand Groq inference capacity in Dammam (Source: Groq).
Full analysis
The AI Inference Data Center Market is valued at USD 270.92 billion in 2026 and is projected to reach USD 1,055.87 billion by 2035, up from USD 162.71 billion in 2025, a CAGR of 20.56% from 2025 to 2035 (DC Market Insights estimate). What moves the money here is token traffic, not model size: Google said its first-party model APIs were processing nearly 32 billion tokens per minute in the third quarter of 2026, more than four times the level a year earlier, and every token served has to run on a powered, cooled accelerator somewhere. Amazon Web Services (AWS) said in October 2026 that inference already accounts for well over half of its artificial intelligence (AI) revenue, so the buyers that once sized halls for training runs now size them for serving. The 2025 receipt is 3.77 GW of AI IT load deployed for inference (41.70% of the 9.04 GW of AI IT load deployed worldwide) × USD 43.16 million of all-in spend per MW = USD 162.71 billion.
The market covers the data-center capacity built and equipped to serve trained AI models: accelerated servers, networking, power and cooling, the shell, storage, and the software and services that run inference fleets, across hyperscale clouds, GPU clouds, colocation, enterprise sites and edge inference sites. Edge Inference Sites are the fastest operator type at 32.13% a year, because latency-bound agents and voice services pull compute toward users, and the Middle East and Africa is the fastest region at 28.48%, led by Saudi Arabia’s USD 2.58 billion market growing 32.34% a year on state-backed inference campuses.
Key Market Statistics: How Big Is the AI Inference Data Center Market in 2026?
The AI Inference Data Center Market is worth USD 270.92 billion in 2026, 66.50% more than the USD 162.71 billion of 2025, according to DC Market Insights estimates.
- Market size 2025: USD 162.71 billion
- Market size 2026: USD 270.92 billion
- Market size 2030: USD 633.41 billion
- Market size 2035: USD 1,055.87 billion
- CAGR 2025-2035: 20.56% (low case 17.15%, high case 22.68%)
- Largest spend layer: Accelerated Servers and Accelerators, USD 99.25 billion in 2025 (61.00%)
- Fastest operator type: Edge Inference Sites, 32.13% a year
- Leading region: North America, 54.00% of 2025 value; fastest region: Middle East and Africa, 28.48%
- Largest country: United States, USD 80.13 billion in 2025
- Market leader: NVIDIA supplies most of the Merchant GPUs segment, which holds 72.00% of 2025 value
Key Takeaways: What Should Buyers of Inference Capacity Know?
Four points summarise the AI Inference Data Center Market for 2026 buyers and suppliers, each with its reason.
- Inference rises from 41.70% of AI data center spend in 2025 to 65.47% in 2035, because training runs are periodic while serving traffic grows with every user and agent.
- Spend per MW stands at USD 43.16 million in 2025 and eases to USD 32.37 million by 2035, because each accelerator generation delivers more tokens per watt.
- Hyperscaler Custom ASICs grow 25.00% a year to USD 348.44 billion, because Google, Amazon and Microsoft move high-volume serving to their own chips.
- Edge Inference Sites grow from USD 6.51 billion to USD 105.59 billion, because voice and agent services need replies inside a few hundred milliseconds.
Executive Summary: How Fast Is AI Inference Data Center Spending Growing?
The Global AI Inference Data Center Market size was valued at USD 11.85 billion in 2020, reached USD 162.71 billion in 2025, and is anticipated to reach USD 1,055.87 billion by 2035, at a CAGR of 20.56% during the forecast period.
| Attribute | Value |
|---|---|
| Historical period | 2020-2024 |
| Base year | 2025 |
| Forecast period | 2026-2035 |
| Market size 2025 | USD 162.71 billion |
| Market size 2026 | USD 270.92 billion |
| CAGR 2025-2035 | 20.56% |
| Market size 2035 | USD 1,055.87 billion |
The AI Inference Data Center Market grew 68.86% a year from 2020 to 2025 as generative AI services launched, then slows to 20.56% a year as the installed base gets large and cost per token falls. DC Market Insights estimates that inference capacity deployed in a year rises from 3.77 GW in 2025 to 15.74 GW in 2030 and 32.62 GW in 2035.
What Does the AI Inference Data Center Market Include?
The AI Inference Data Center Market counts USD 162.71 billion of 2025 spend on capacity that serves trained models to users, applications and agents.
Included: accelerated servers and accelerators placed in inference service, the networking inside and between inference halls, power and cooling equipment, shell and fit-out for inference capacity, storage for model weights and context caches, and the orchestration software and services that run serving fleets.
Excluded: capacity used for model training and fine-tuning runs, electricity bills, land, consumer devices and on-device inference in phones and personal computers, and the API or subscription revenue earned from selling tokens.
How the segments fit together: every segment table sums to the market total in each year. The AI Inference Data Center Market is a workload slice of the AI Data Center Market, whose inference row matches these figures exactly (USD 162.71 billion in 2025, USD 1,055.87 billion in 2035).
Why Do AI Inference Data Center Market Estimates Differ?
DC Market Insights puts the AI Inference Data Center Market at USD 270.92 billion in 2026; published figures for similar names range from a few billion to several hundred billion dollars because they count different things.
Narrow definitions count only inference chips or inference servers, so they leave out networking, power, cooling and the hall itself. Wide definitions count inference-as-a-service revenue, which is the price of tokens sold rather than the cost of the capacity behind them. Some estimates also add on-device inference in smartphones and personal computers, which never touches a data center. DC Market Insights counts capacity spend in data centers only, so its estimate sits between the narrow and the wide views.
| Element | Counted by DC Market Insights | Why |
|---|---|---|
| Inference accelerators and servers | Yes, USD 99.25 billion (2025) | Core of serving capacity |
| Networking, power, cooling, shell, storage | Yes, USD 41.49 billion (2025) | Needed to run accelerators |
| Serving software and services | Yes, USD 21.97 billion (2025) | Runs the fleet |
| Training capacity | No | Covered in the AI Data Center Market |
| Token and API revenue | No | Price, not capacity |
| On-device inference | No | Not in a data center |
Small and mid-sized enterprises are in scope when they buy inference capacity through GPU clouds, colocation or their own server rooms; their spend sits mostly in the Enterprise On-Premises and GPU Cloud and Neocloud segments.
Market Drivers: What Is Pushing AI Inference Data Center Spending Up?
Three measurable forces lift the AI Inference Data Center Market from USD 162.71 billion in 2025 to USD 633.41 billion in 2030.
Google’s First-Party APIs Reached 32 Billion Tokens per Minute
Google said in February 2026 that customers were processing over 10 billion tokens per minute through direct API use in the fourth quarter of 2025, and in October 2026, on a wider measure, that its first-party model APIs were processing nearly 32 billion tokens per minute, more than four times a year earlier (Alphabet, Q3 2026 results). Served tokens, not model releases, set how many accelerators must run around the clock; this is why DC Market Insights models inference capacity deployed at 3.77 GW in 2025 and 15.74 GW in 2030.
2026 Capex Guidance of About USD 710 Billion From Four Buyers
Alphabet guided 2026 capital expenditure to USD 175-185 billion (February 2026), Amazon expects about USD 220 billion (October 2026), Microsoft about USD 170 billion for calendar 2026 (October 2026) and Meta USD 135-145 billion (October 2026). At the midpoints that is about USD 710 billion; the AI Inference Data Center Market at USD 270.92 billion in 2026 equals 38.16% of it. Amazon said inference already accounts for well over half of AWS AI revenue (Amazon, October 2026), so a growing part of that capex is serving capacity.
Chips Built for Serving: Ironwood, Maia 200 and Rubin CPX
Google called its Ironwood tensor processing unit (TPU) the first designed specifically for inference (April 2025), with pods of 9,216 liquid-cooled chips and twice the performance per watt of Trillium. Microsoft said in October 2026 that Maia 200 delivers up to 1.7 times more tokens per watt in Teams and Copilot, and NVIDIA plans Rubin CPX, a graphics processing unit (GPU) for long-context inference, for the end of 2026 (NVIDIA, September 2025). These parts lift Hyperscaler Custom ASICs from USD 37.42 billion in 2025 to USD 348.44 billion in 2035.
Market Trends: How Are Inference Halls Being Designed Differently?
Two design shifts change what an inference hall buys, and both raise networking and memory content in the AI Inference Data Center Market.
Prefill and Decode Split Into Separate Racks
NVIDIA said in August 2026 that its Groq 3 LPX decode rack, with 256 LP30 accelerators linked chip to chip, was in full production with Nebius as the first adopter, while the Vera Rubin NVL144 CPX rack pairs 8 exaflops with 100 TB of fast memory for the context-heavy prefill stage. Splitting the two stages adds rack-to-rack traffic, which is why Networking and Interconnect grows 22.65% a year to USD 100.31 billion.
Inference-Only Clouds Open Their Own Sites
Cerebras announced in March 2025 a network of inference data centers in Santa Clara, Stockton, Dallas, Minneapolis, Oklahoma City, Montreal and further US and European sites to serve over 40 million Llama 70B tokens per second, 85% of it in the United States (Cerebras, March 2025). Groq opened a Helsinki site with Equinix in July 2025 while serving more than 20 million tokens per second. Dedicated Inference Accelerators grow 30.46% a year from USD 8.14 billion in 2025.
Market Challenges: What Limits Inference Capacity Growth?
Power supply and falling price per token are the two limits that keep the AI Inference Data Center Market at 20.56% a year rather than the 68.86% of 2020-2025.
Grid Capacity: 6.7-12% of US Electricity by 2028
The US Department of Energy (DOE) reported in December 2024 that data centers used about 4.4% of US electricity in 2023 and could use 6.7% to 12% (325-580 TWh) by 2028 (DOE, December 2024). Inference fleets run near-continuously, so every 1 GW of inference IT load at a power usage effectiveness (PUE) of 1.2 and 55% average utilisation draws about 5.8 TWh a year; the 15.74 GW of inference capacity deployed in 2030 alone would need about 91 TWh at those settings.
Cheaper Tokens Lower Spend per Megawatt
NVIDIA’s chief executive said in February 2026 that Grace Blackwell with NVLink delivers an order-of-magnitude lower cost per token, and Microsoft and Google each report 1.7 to 2 times more tokens per watt per chip generation. More tokens per dollar means less spend per unit of demand, which is why DC Market Insights models all-in spend per inference MW falling from USD 43.16 million in 2025 to USD 32.37 million in 2035.
Market Opportunities: Where Is the Next USD 100 Billion of Inference Spend?
Edge sites and sovereign campuses add about USD 181.51 billion of new annual value in the AI Inference Data Center Market between 2025 and 2035.
Edge Inference Sites: USD 6.51 billion to USD 105.59 billion
Voice agents, video analytics and in-store assistants need answers in under a few hundred milliseconds, which favours metro and edge sites over remote campuses. DC Market Insights estimates the Edge Inference Sites segment grows 32.13% a year, the fastest operator type, with servers sold through the Edge Server Market.
Sovereign Inference in the Gulf: USD 7.32 billion to USD 89.75 billion
Saudi Arabia committed USD 1.5 billion to Groq in February 2025 to expand inference capacity at its Dammam data center. DC Market Insights estimates the Middle East and Africa grows 28.48% a year, with Saudi Arabia at 32.34% and the United Arab Emirates at 30.48%.
How Much Does a Megawatt of Inference Capacity Cost?
DC Market Insights estimates all-in spend of USD 43.16 million per MW of inference IT load deployed in 2025, covering servers, networking, power, cooling, shell, storage, software and services.
| Year | Inference IT load deployed (GW) | All-in spend per MW (USD million) | Market (USD million) |
|---|---|---|---|
| 2020 | 0.55 | 21.47 | 11,852.13 |
| 2025 | 3.77 | 43.16 | 162,710.91 |
| 2030 | 15.74 | 40.24 | 633,412.29 |
| 2035 | 32.62 | 32.37 | 1,055,872.42 |
Public anchors support the downward path after 2026. NVIDIA claims Rubin CPX can return USD 5 billion of token revenue for every USD 100 million invested (a vendor claim, September 2025); Microsoft reports up to 1.7 times more tokens per watt from Maia 200; Google reports twice the performance per watt for Ironwood over Trillium. The 2025-2026 high point reflects liquid-cooled rack-scale systems entering service before those gains spread across fleets.
Which Rules Shape Where Inference Capacity Is Built?
Four rules affect the AI Inference Data Center Market, which DC Market Insights values at USD 270.92 billion in 2026, through reporting duties, data location and power.
- EU Artificial Intelligence Act: in force on 1 August 2024; rules for general-purpose AI models applied from 2 August 2025, and the European Commission now lists 2 December 2027 for Annex III high-risk systems (Source: European Commission AI Act Service Desk).
- Commission Delegated Regulation (EU) 2024/1364: data centers of 500 kW and above report energy and water use to a common EU database (Source: EUR-Lex).
- US Department of Energy report of December 2024: data-center electricity of 6.7-12% of US demand by 2028 frames utility large-load tariffs (Source: DOE).
- International Energy Agency (IEA) Energy and AI report, April 2025: about 945 TWh of data-centre electricity by 2030 (Source: IEA).
How Is the AI Inference Data Center Market Segmented?
The AI Inference Data Center Market is split four ways; Accelerated Servers and Accelerators lead with USD 99.25 billion or 61.00% of 2025 value. All values are DC Market Insights estimates in USD million.
By Spend Layer
Storage grows fastest at 23.29% a year because long-context serving keeps large key-value caches close to accelerators.
| Segment | 2025 (USD million) | Share 2025 | 2035 (USD million) | CAGR 2025-2035 |
|---|---|---|---|---|
| Accelerated Servers and Accelerators | 99,253.66 | 61.00% | 596,567.92 | 19.64% |
| Networking and Interconnect | 13,016.87 | 8.00% | 100,307.88 | 22.65% |
| Power and Cooling Infrastructure | 13,830.43 | 8.50% | 92,916.77 | 20.98% |
| Facility Shell and Construction | 8,135.55 | 5.00% | 46,458.39 | 19.03% |
| Storage | 6,508.44 | 4.00% | 52,793.62 | 23.29% |
| Software and Services | 21,965.96 | 13.50% | 166,827.84 | 22.48% |
| Total | 162,710.91 | 100.00% | 1,055,872.42 | 20.56% |
By Operator Type
Hyperscale Cloud holds 56.00% of 2025 value; GPU Cloud and Neocloud operators grow 23.84% a year as model developers rent serving capacity.
| Segment | 2025 (USD million) | Share 2025 | 2035 (USD million) | CAGR 2025-2035 |
|---|---|---|---|---|
| Hyperscale Cloud | 91,118.11 | 56.00% | 496,260.04 | 18.47% |
| GPU Cloud and Neocloud | 21,152.42 | 13.00% | 179,498.31 | 23.84% |
| Colocation Tenants | 19,525.31 | 12.00% | 147,822.14 | 22.44% |
| Enterprise On-Premises | 24,406.64 | 15.00% | 126,704.69 | 17.90% |
| Edge Inference Sites | 6,508.43 | 4.00% | 105,587.24 | 32.13% |
| Total | 162,710.91 | 100.00% | 1,055,872.42 | 20.56% |
By Accelerator Type
Merchant GPUs hold 72.00% of 2025 value and fall to 56.00% by 2035 as custom and dedicated chips take serving volume.
| Segment | 2025 (USD million) | Share 2025 | 2035 (USD million) | CAGR 2025-2035 |
|---|---|---|---|---|
| Merchant GPUs | 117,151.86 | 72.00% | 591,288.56 | 17.57% |
| Hyperscaler Custom ASICs | 37,423.51 | 23.00% | 348,437.90 | 25.00% |
| Dedicated Inference Accelerators | 8,135.54 | 5.00% | 116,145.96 | 30.46% |
| Total | 162,710.91 | 100.00% | 1,055,872.42 | 20.56% |
By Application
Generative AI and LLM Serving holds 56.00% of 2025 value; Agentic and Reasoning Workloads grow 26.88% a year because each agent task chains many model calls.
| Segment | 2025 (USD million) | Share 2025 | 2035 (USD million) | CAGR 2025-2035 |
|---|---|---|---|---|
| Generative AI and LLM Serving | 91,118.11 | 56.00% | 675,758.35 | 22.19% |
| Recommendation and Ranking | 37,423.51 | 23.00% | 147,822.14 | 14.73% |
| Computer Vision | 14,643.98 | 9.00% | 73,911.07 | 17.57% |
| Speech and Language | 9,762.65 | 6.00% | 52,793.62 | 18.39% |
| Agentic and Reasoning Workloads | 9,762.66 | 6.00% | 105,587.24 | 26.88% |
| Total | 162,710.91 | 100.00% | 1,055,872.42 | 20.56% |
DC Exclusive: The Token-to-Megawatt Bridge for Three Inference Networks
The Token-to-Megawatt Bridge is a DC Market Insights model built on 6 inputs that turns published token rates into installed IT megawatts and capacity value; Google’s first-party API traffic alone implies about 485 MW of installed inference IT load.
Inputs: the published token rate of each network, 0.5 joules of IT energy per token (a DC Market Insights assumption for a mixed fleet of large and small models), 55% average utilisation of installed capacity, a PUE of 1.2 and USD 43.16 million of all-in spend per MW (2025). Token rates come from Alphabet’s Q3 2026 results, Cerebras (March 2025) and Groq (July 2025).
| Network | Tokens per second (million) | Average IT load (MW) | Installed IT (MW) | Facility load (MW) | Capacity value (USD billion) |
|---|---|---|---|---|---|
| Google first-party model APIs (Q3 2026) | 533 | 266.7 | 484.8 | 581.8 | 20.93 |
| Cerebras inference network target (March 2025) | 40 | 20.0 | 36.4 | 43.6 | 1.57 |
| Groq global network (July 2025) | 20 | 10.0 | 18.2 | 21.8 | 0.78 |
At 0.25 joules per token the Google figure halves to about 242 MW; at 1.0 joule it doubles to about 970 MW. Even the high case is a fraction of the 3,770 MW of inference capacity deployed in 2025, which shows how much serving demand sits outside first-party APIs: consumer apps, search features, recommendation engines and enterprise models.
Which Region Leads the AI Inference Data Center Market?
North America leads with USD 87.86 billion or 54.00% of 2025 value, and the Middle East and Africa grows fastest at 28.48% a year (DC Market Insights estimate).
| Region | 2025 (USD million) | Share 2025 | 2035 (USD million) | CAGR 2025-2035 |
|---|---|---|---|---|
| North America | 87,863.89 | 54.00% | 496,260.04 | 18.90% |
| Asia Pacific | 42,304.84 | 26.00% | 300,923.64 | 21.68% |
| Europe | 20,176.15 | 12.40% | 126,704.69 | 20.17% |
| Middle East and Africa | 7,321.99 | 4.50% | 89,749.16 | 28.48% |
| Latin America | 5,044.04 | 3.10% | 42,234.89 | 23.68% |
| Total | 162,710.91 | 100.00% | 1,055,872.42 | 20.56% |
North America
North America grows from USD 87.86 billion to USD 496.26 billion. Microsoft said it added about 1 GW of capacity in the quarter to June 2026, and 85% of Cerebras’s planned inference capacity is in the United States.
Asia Pacific
Asia Pacific grows 21.68% a year to USD 300.92 billion; China is the second-largest country at USD 23.18 billion in 2025 and India the fastest large market at 29.85% (DC Market Insights estimates).
Europe
Europe grows 20.17% a year to USD 126.70 billion. Groq’s Helsinki site (July 2025) and the EU AI Act’s general-purpose model rules from August 2025 push European operators to serve models inside the EU.
Middle East and Africa
The Middle East and Africa grows 28.48% a year from USD 7.32 billion; Saudi Arabia’s USD 1.5 billion Groq commitment for Dammam (February 2025) is the clearest sovereign inference project in the region.
Latin America
Latin America grows 23.68% a year from USD 5.04 billion to USD 42.23 billion, as cloud regions in Brazil and Mexico add serving capacity for Spanish- and Portuguese-language models (DC Market Insights estimate).
Which Countries Spend the Most on AI Inference Data Centers?
The United States leads with USD 80.13 billion in 2025; Saudi Arabia is the fastest-growing country in the top 12 at 32.34% a year (DC Market Insights estimate).
| Rank | Country | Region | 2025 (USD million) | 2035 (USD million) | CAGR 2025-2035 |
|---|---|---|---|---|---|
| 1 | United States | North America | 80,131.87 | 449,452.42 | 18.82% |
| 2 | China | Asia Pacific | 23,183.05 | 152,346.01 | 20.72% |
| 3 | Canada | North America | 6,501.93 | 39,947.74 | 19.91% |
| 4 | Japan | Asia Pacific | 4,991.97 | 31,439.81 | 20.20% |
| 5 | United Kingdom | Europe | 4,761.57 | 28,714.34 | 19.68% |
| 6 | Germany | Europe | 4,115.93 | 25,994.74 | 20.24% |
| 7 | South Korea | Asia Pacific | 3,426.69 | 24,565.45 | 21.77% |
| 8 | India | Asia Pacific | 3,045.95 | 41,494.72 | 29.85% |
| 9 | France | Europe | 2,965.89 | 21,159.98 | 21.71% |
| 10 | Saudi Arabia | Middle East and Africa | 2,577.34 | 42,475.99 | 32.34% |
| 11 | Australia | Asia Pacific | 2,453.68 | 18,691.20 | 22.51% |
| 12 | United Arab Emirates | Middle East and Africa | 2,328.39 | 33,304.97 | 30.48% |
India is the fastest large economy at 29.85% a year, from USD 3.05 billion to USD 41.49 billion, as Indian-language assistants and government AI services are served from domestic capacity.
Forecast Scenarios: What Is the 2035 Range for AI Inference Data Center Spending?
DC Market Insights puts the 2035 AI Inference Data Center Market between USD 791.90 billion and USD 1,256.49 billion, with USD 1,055.87 billion as the base case.
| Scenario | 2035 (USD million) | CAGR 2025-2035 | Assumption |
|---|---|---|---|
| Low | 791,904.31 | 17.15% | Grid limits and faster cost-per-token declines |
| Base | 1,055,872.42 | 20.56% | Inference reaches 65.47% of AI data center spend |
| High | 1,256,488.18 | 22.68% | Agentic workloads multiply calls per task |
Key Players and Market Share: Who Builds and Supplies AI Inference Data Centers?
The five largest cloud operators (AWS, Microsoft, Google, Meta and Oracle) account for about 56% of 2025 AI Inference Data Center Market value, equal to the Hyperscale Cloud segment (DC Market Insights estimate based on operator capex).
- NVIDIA
- Amazon Web Services (AWS)
- Microsoft
- Meta
- Oracle
- AMD
- Broadcom
- Cerebras
- Groq
- CoreWeave
- Nebius
- Dell Technologies
- Supermicro
- Equinix
- Digital Realty
- Vertiv
NVIDIA reported record fiscal 2026 revenue of USD 193.7 billion (February 2026) and supplies most merchant GPU serving systems. Google, Amazon (Inferentia and Trainium) and Microsoft (Maia) supply their own fleets with custom chips. Cerebras and Groq run dedicated inference networks, and CoreWeave and Nebius rent serving capacity to model developers.
Recent Developments in the AI Inference Data Center Market
Six dated events since February 2025 shape the AI Inference Data Center Market, worth USD 270.92 billion in 2026.
- In October 2026, Google said its first-party model APIs were processing nearly 32 billion tokens per minute (Source: Alphabet Q3 2026 results, Google).
- In October 2026, Amazon said inference accounts for well over half of AWS AI revenue and Trainium commitments rose more than 20 times year on year (Source: Amazon).
- In August 2026, NVIDIA said its Groq 3 LPX decode rack was in full production, with Nebius as the first adopter (Source: NVIDIA).
- In July 2025, Groq opened a European inference site in Helsinki with Equinix (Source: Groq).
- In April 2025, Google introduced Ironwood, its first TPU designed for inference (Source: Google).
- In February 2025, Saudi Arabia committed USD 1.5 billion to expand Groq inference capacity in Dammam (Source: Groq).
Research Methodology: How DC Market Insights Sized the AI Inference Data Center Market
DC Market Insights sized the AI Inference Data Center Market at USD 162.71 billion in 2025 as the inference share (41.70%) of USD 390.19 billion of AI data center spend, built from 9.04 GW of AI IT load deployed × USD 43.16 million all-in spend per MW. The inference share rises to 56.50% in 2030 and 65.47% in 2035; splits by spend layer, operator, accelerator, application, region and country sum to the total each year.
Three bound checks: (1) the Accelerated Servers and Accelerators line of USD 99.25 billion in 2025 is 51.24% of NVIDIA’s fiscal 2026 revenue of USD 193.7 billion, a ceiling that also covers training; (2) the 2026 market of USD 270.92 billion is 38.16% of the about USD 710 billion 2026 capex guided by Alphabet, Amazon, Microsoft and Meta, a second ceiling; (3) Google’s first-party API traffic alone implies about USD 20.93 billion of capacity, a floor that is 12.86% of the 2025 market. Full method: DC Market Insights research methodology. Related coverage: Data Center Accelerator Market and GPU as a Service Market.
Table of contents
- 01Introduction
- 1.1Market Definition and Scope
- 1.2Included and Excluded Elements
- 1.3Why Estimates Differ
- 02Executive Summary
- 2.1Market Snapshot, 2025, 2026 and 2035
- 2.2Key Market Statistics
- 2.3Key Takeaways
- 03Market Dynamics
- 3.1Google Token Volume
- 3.22026 Capex Guidance of Four Buyers
- 3.3Chips Built for Serving
- 3.4Prefill and Decode Split Into Separate Racks
- 3.5Inference-Only Clouds
- 3.6Grid Capacity
- 3.7Cheaper Tokens Lower Spend per Megawatt
- 3.8Edge Inference Sites Opportunity
- 3.9Sovereign Inference in the Gulf
- 04Pricing Analysis
- 4.1All-in Spend per MW, 2020, 2025, 2030 and 2035
- 4.2Public Price and Efficiency Anchors
- 05Standards and Regulation
- 5.1EU Artificial Intelligence Act
- 5.2Commission Delegated Regulation (EU) 2024/1364
- 5.3US Department of Energy Report
- 5.4IEA Energy and AI
- 06Market Segmentation by Spend Layer
- 6.1Accelerated Servers and Accelerators
- 6.2Networking and Interconnect
- 6.3Power and Cooling Infrastructure
- 6.4Facility Shell and Construction
- 6.5Storage
- 6.6Software and Services
- 07Market Segmentation by Operator Type
- 7.1Hyperscale Cloud
- 7.2GPU Cloud and Neocloud
- 7.3Colocation Tenants
- 7.4Enterprise On-Premises
- 7.5Edge Inference Sites
- 08Market Segmentation by Accelerator Type
- 8.1Merchant GPUs
- 8.2Hyperscaler Custom ASICs
- 8.3Dedicated Inference Accelerators
- 09Market Segmentation by Application
- 9.1Generative AI and LLM Serving
- 9.2Recommendation and Ranking
- 9.3Computer Vision
- 9.4Speech and Language
- 9.5Agentic and Reasoning Workloads
- 10DC Exclusive: Token-to-Megawatt Bridge
- 10.1Google First-Party Model APIs
- 10.2Cerebras Inference Network
- 10.3Groq Global Network
- 10.4Sensitivity to Energy per Token
- 11Regional Insights
- 11.1North America
- 11.2Asia Pacific
- 11.3Europe
- 11.4Middle East and Africa
- 11.5Latin America
- 12Country Analysis
- 12.1United States
- 12.2China
- 12.3Canada
- 12.4Japan
- 12.5United Kingdom
- 12.6Germany
- 12.7South Korea
- 12.8India
- 12.9France
- 12.10Saudi Arabia
- 12.11Australia
- 12.12United Arab Emirates
- 13Forecast Scenarios
- 13.1Low Scenario
- 13.2Base Scenario
- 13.3High Scenario
- 14Competitive Insights
- 14.1NVIDIA
- 14.2Amazon Web Services (AWS)
- 14.3Microsoft
- 14.4Google
- 14.5Meta
- 14.6Oracle
- 14.7AMD
- 14.8Broadcom
- 14.9Cerebras
- 14.10Groq
- 14.11CoreWeave
- 14.12Nebius
- 14.13Dell Technologies
- 14.14Supermicro
- 14.15Equinix
- 14.16Digital Realty
- 14.17Vertiv
- 15Recent Developments
- 15.1October 2026: Google Token Volume
- 15.2October 2026: AWS Inference Share
- 15.3August 2026: NVIDIA Groq 3 LPX
- 15.4July 2025: Groq Helsinki
- 15.5April 2025: Google Ironwood
- 15.6February 2025: Saudi Arabia and Groq
- 16Research Methodology
- 16.1Model Build
- 16.2Bound Checks
- Fig. 1AI Inference Data Center Market Size, 2020-2035 (USD billion)
- Table 1Market Snapshot Attributes
- Table 2Scope Comparison: Elements Counted
- Table 3All-in Spend per MW of Inference Capacity, 2020-2035
- Table 4Market by Spend Layer, 2025 and 2035
- Table 5Market by Operator Type, 2025 and 2035
- Table 6Market by Accelerator Type, 2025 and 2035
- Table 7Market by Application, 2025 and 2035
- Table 8Token-to-Megawatt Bridge for Three Inference Networks
- Table 9Market by Region, 2025 and 2035
- Table 10Top 12 Countries, 2025 and 2035
- Table 11Forecast Scenarios, 2035
About this report
Written by Amit Jain and reviewed by Deepti Agrawal, Senior Editor, Research. Figures are built top-down and bottom-up and reconciled before publication, with 2025 as the base year.
Read our methodologyHow we built this
- Historical period2020-2024
- Base year2025
- Forecast period2026-2035
- Sizing approachTop-down + bottom-up
Need more than the report?
Advisory on this market
Due diligence, site selection and market entry work, by the analysts who wrote this report.
See consulting servicesFrequently asked questions
USD 270.92 billion in 2026, up 66.50% from USD 162.71 billion in 2025, according to DC Market Insights estimates. The market is projected to reach USD 1,055.87 billion by 2035, a CAGR of 20.56% from 2025.
20.56% a year from 2025 to 2035, after 68.86% a year from 2020 to 2025, as inference rises from 41.70% to 65.47% of AI data center spend (DC Market Insights estimate).
About USD 43.16 million per MW of IT load deployed in 2025, all-in, falling to USD 32.37 million by 2035 as chips deliver more tokens per watt (DC Market Insights estimate).
41.70% in 2025, or USD 162.71 billion of USD 390.19 billion, rising to 65.47% by 2035. Amazon said in October 2026 that inference is well over half of AWS AI revenue.
Edge Inference Sites, at 32.13% a year from USD 6.51 billion in 2025 to USD 105.59 billion in 2035, because voice and agent services need low-latency replies.
Partly: Hyperscaler Custom ASICs grow 25.00% a year to USD 348.44 billion, while Merchant GPUs fall from 72.00% to 56.00% of value but still lead in 2035 (DC Market Insights estimate).
North America, with 54.00% or USD 87.86 billion of 2025 value. The Middle East and Africa grows fastest at 28.48% a year, led by Saudi Arabia.
About 485 MW of installed IT load for nearly 32 billion tokens per minute, at 0.5 joules per token and 55% utilisation, worth about USD 20.93 billion of capacity (DC Market Insights model).
About 56% of 2025 value sits with AWS, Microsoft, Google, Meta and Oracle (DC Market Insights estimate). NVIDIA supplies most merchant GPU systems; Cerebras, Groq, CoreWeave and Nebius run inference-focused clouds.
DC Market Insights counts USD 270.92 billion in 2026 of data-center capacity spend only. Estimates that count only chips are smaller; those that count token revenue or on-device inference are not comparable.
Get this report
How do I get the full report?
Request a quote; we reply by email within one business day.
How and when will I receive the report?
By email, within 24–48 business hours of payment.
How can I pay?
Once you accept the quote, we email you a secure payment link.
Can I see a sample first?
Yes. Request a free sample and we will email it to you.
Can the report be tailored to my needs?
Yes. We can add countries, segments or data cuts. Talk to an analyst about the scope you need.
Can I get an invoice or pay against a purchase order?
Write to sales@dcmarketinsights.com and our team will help.