
China Data Center Racks Market Size, Share & Forecast to 2035
Market at a glance
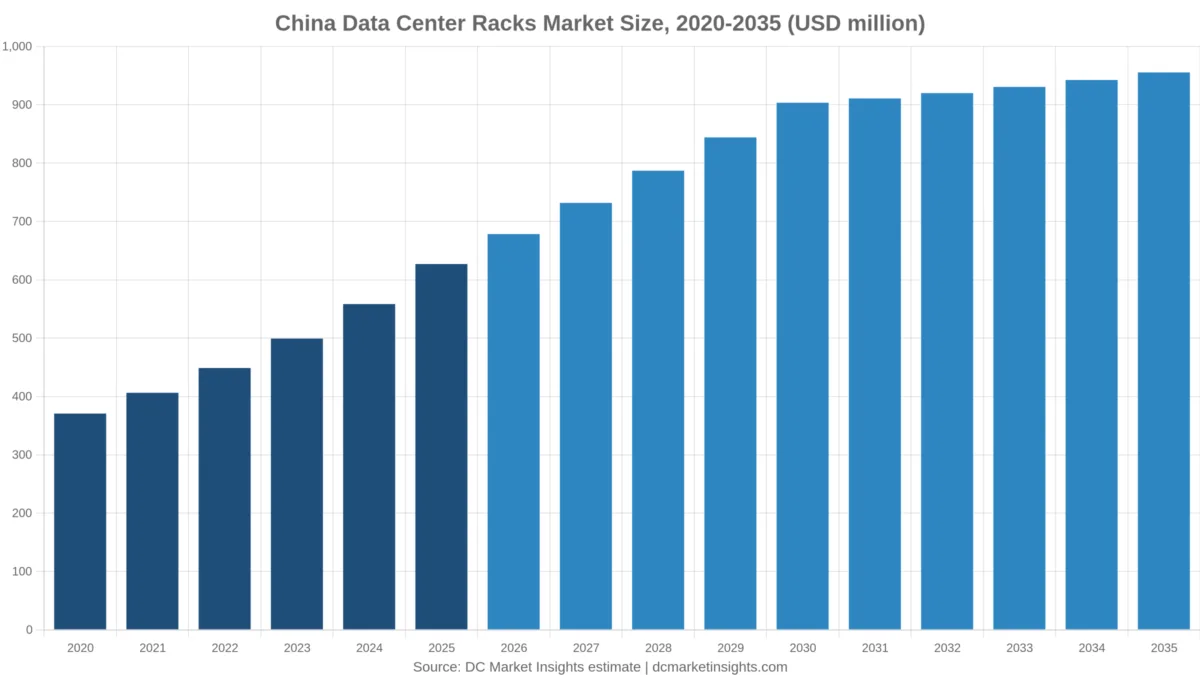
The China Data Center Racks market was worth USD 626.9 million in 2025 and is forecast to reach USD 955.4 million by 2035, growing at a 4.3% CAGR.
 By Amit Jain, Senior Consultant, ICT & Emerging Technologies
 Reviewed by Deepti Agrawal
Last updated 29 Oct 2026
Base year 2025 PDF + Excel
Key findings
Supernode cabinets that hold 640 accelerators
Liquid cooling moves into the cabinet frame
Fewer racks per megawatt
Liquid-ready retrofits and new frames worth USD 595.98 million by 2035
What is inside the report
- 01Introduction
- 02Key Market Statistics
- 03Executive Summary
- 04Why Estimates Differ
- 05Market Drivers
- 06Market Trends
- 07Market Challenges
- 08Market Opportunities
- 09Pricing Analysis
- 10Standards and Regulation
- 18chapters
- 2020-2024Historical period
- 2026-2035Forecast period
- 15Companies profiled
Segmentation
Companies profiled
- Huawei (FusionModule cabinets and modules)
- Inspur Electronic Information
- ZTE
- Sugon and Sugon Data Energy
- Foxconn Industrial Internet (FII)
- Kehua Data
- H3C
- Lenovo
- Vertiv
- Schneider Electric
- Rittal
- Delta Electronics
- Invt (Shenzhen INVT Electric)
- Eaton
- Legrand (Minkels and Raritan)
Recent developments
MIIT and four other ministries set the national green computing facility criteria of at least 3,000 standard racks and 60% occupancy (Source: MIIT).
the National Data Administration reported more than 13.73 million standard racks in use at the end of 2025 (Source: National Data Administration).
Kehua Data reported more than 2,000 all-in-one cabinets delivered and 40-120 kW liquid POD cabinets (Source: Kehua Data 2025 annual report).
ZTE reported its data center products deployed across more than 300,000 racks (Source: ZTE 2025 annual report).
MIIT reported 938,000 racks serving outside customers, up 108,000 (Source: MIIT).
Sugon launched the scaleX640 single-cabinet 640-accelerator supernode (Source: Sugon).
Full analysis
The China Data Center Racks Market is valued at USD 678.32 million in 2026 and is projected to reach USD 955.36 million by 2035, up from USD 626.93 million in 2025, a CAGR of 4.30% from 2025 to 2035 (DC Market Insights estimate). Rack spending in China grows far more slowly than the halls around it because rack density is rising: a conventional hall needed about 167 racks per megawatt (MW) of IT load at 6 kW per rack in 2025, while an AI hall at 30 kW needs about 33, so each new MW buys fewer, heavier and dearer cabinets. The National Data Administration counted more than 13.73 million standard racks in use at the end of 2025, up from more than 9 million a year earlier (Source: Digital China development report, April 2026), and the 2025 receipt is 32,933 AI rack-scale cabinets × USD 9,000 = USD 296.40 million, plus 268,667 conventional cabinets × USD 950 = USD 255.23 million, plus 79,255 replacement cabinets × USD 950 = USD 75.29 million. AI rack-scale cabinets grow fastest among rack types at 7.89% a year, and the Western Hub Provinces grow fastest among regions at 10.31% a year as Inner Mongolia and Ningxia take more of the national compute build.
The China Data Center Racks Market covers the steel and aluminium cabinets, open frames and enclosures that hold servers, storage and network gear in Chinese data centers, together with their rails, doors, cable management and liquid-ready frame parts such as in-rack manifolds and busbar mounts.
Key Market Statistics: How Much Will China Spend on Data Center Racks in 2026?
China will spend USD 678.32 million on data center racks in 2026, 8.20% more than the USD 626.93 million of 2025, DC Market Insights estimates.
- Market size 2025: USD 626.93 million
- Market size 2026: USD 678.32 million
- Market size 2030: USD 903.37 million
- Market size 2035: USD 955.36 million
- CAGR 2025-2035: 4.30% (low case 2.00%, high case 6.40%)
- Largest rack type 2025: AI Rack-Scale Cabinets, USD 296.40 million (47.28%)
- Fastest segment: Liquid-Ready Racks, 13.17% a year
- Leading region: Yangtze River Delta, USD 188.08 million (30.00%)
- Fastest region: Western Hub Provinces, 10.31% a year
- Largest province: Guangdong, USD 106.58 million in 2025
- Market leader: Huawei, about 13% of 2025 rack value (DC Market Insights estimate)
Key Takeaways: What Should Rack Buyers and Suppliers in China Know?
- Rack value rises 4.30% a year while new IT capacity rises about 8.7% a year, because rack counts per MW fall from 167 to 100 in conventional halls and from 33 to 10 in AI halls by 2035.
- AI rack-scale cabinets already carry 47.28% of 2025 value because each one costs about USD 9,000 against USD 950 for a standard cabinet.
- Liquid-ready racks grow 13.17% a year because air cooling tops out at about 20 kW per cabinet, according to Sugon Data Energy’s 2025 annual report.
- Western Hub Provinces grow 10.31% a year because new hub capacity is steered to Inner Mongolia, Ningxia and Guizhou.
Executive Summary: How Big Is the China Data Center Racks Market from 2020 to 2035?
The China Data Center Racks Market size was valued at USD 370.67 million in 2020, reached USD 626.93 million in 2025, and is anticipated to reach USD 955.36 million by 2035, at a CAGR of 4.30% during the forecast period.
| Attribute | Value |
|---|---|
| Historical period | 2020-2024 |
| Base year | 2025 |
| Forecast period | 2026-2035 |
| Market size 2025 | USD 626.93 million |
| Market size 2026 | USD 678.32 million |
| CAGR 2025-2035 | 4.30% |
| Market size 2035 | USD 955.36 million |
Growth was faster from 2020 to 2025, at 11.08% a year, because the AI share of new IT capacity rose from 5% to 38% and each AI cabinet costs nearly ten times a standard one. From 2030 the curve flattens to under 1.2% a year: new capacity levels off near 6,000 MW a year in the DC Market Insights China model, and AI racks reach 100 kW each, so the count of new AI cabinets falls from 40,600 in 2030 to 38,400 in 2035.
Market Scope: Which Racks Does the China Data Center Racks Market Count?
The China Data Center Racks Market counts USD 626.93 million of 2025 rack hardware bought for data centers in mainland China.
Included
- Enclosed server cabinets (mostly 600 mm and 800 mm wide, 42U to 47U)
- AI rack-scale cabinets: reinforced 48U-plus frames for integrated GPU systems, with manifold, busbar and rear-door mounts
- Open frame racks for network rooms and hyperscale halls
- Network and edge enclosures used inside data center sites
- Rails, doors, side panels, blanking and cable management sold with the rack
Excluded
- Servers, storage and switches (counted in the China Data Center Market)
- Power distribution units (PDUs), UPS and busway
- Cooling units, coolant distribution units and rear-door heat exchangers (counted in the China Data Center Cooling Market)
- Prefabricated module shells, buildings and raised floors
How the segments fit together
Every dimension below adds up to the same USD 626.93 million for 2025 and USD 955.36 million for 2035. Rack type, cooling readiness and rack height describe the cabinet itself; end user describes the buyer.
Why Do China Data Center Racks Market Estimates Differ?
Published figures for this market differ because some count only standard cabinets while others add PDUs, cooling and whole prefabricated modules; DC Market Insights puts the 2026 rack layer at USD 678.32 million.
The earlier DC Market Insights edition of this page put 2025 at USD 318.48 million because it priced every rack as a standard cabinet. This edition counts the reinforced AI rack-scale cabinet as its own product at about USD 9,000, which adds USD 296.40 million in 2025. Broader definitions also add power distribution units, in-row cooling, containment aisles, micro-module data centers sold as one unit and server enclosures for telecom cabinets outdoors; those layers can triple the headline. Small and mid-sized enterprises (SMEs) buying single cabinets for server rooms sit inside the Government and Enterprise segment here, but only when the room is a data center site.
| Element | In this report | Why |
|---|---|---|
| Standard server cabinets | Yes | USD 264.42 million in 2025 |
| AI rack-scale cabinets | Yes | USD 296.40 million in 2025 |
| PDUs and busway | No | Power layer, priced per kW not per cabinet |
| Cooling units and containment aisles | No | Thermal layer, covered in the China Data Center Cooling Market |
| Micro-module data centers sold as one unit | Rack part only | The cabinet share of the module is counted |
Market Drivers: What Pushes Rack Spending Up in China?
Three forces lift rack spending by USD 51.39 million between 2025 and 2026, DC Market Insights estimates.
Supernode cabinets that hold 640 accelerators
Sugon launched the scaleX640 in November 2025, a single cabinet holding 640 accelerators with immersion phase-change cooling, which Sugon says lifts compute density per cabinet 20 times (Source: Sugon, scaleX640 launch). Sugon Data Energy’s 2025 annual report says its C8000 V3.0 platform supports more than 900 kW per cabinet. Cabinets of this class are custom steel, wider and deeper, rated for heavy loads and pre-plumbed, so DC Market Insights prices the AI rack-scale class at USD 9,000 in 2025, rising to USD 16,500 by 2035. That price lift, not the unit count, carries 66.32% of 2035 rack value.
13.73 million standard racks and a 4.7 million-rack year
China added roughly 4.7 million standard racks of capacity in 2025, from more than 9 million at the end of 2024 to more than 13.73 million at the end of 2025, according to the National Data Administration. A standard rack is a 2.5 kW capacity unit, so the jump equals about 11.8 GW of rack capacity, of which the DC Market Insights model treats 2,600 MW as new IT load put into halls in 2025. The Ministry of Industry and Information Technology (MIIT) separately counted 938,000 racks serving outside customers at the end of 2025, up 108,000 in a year (Source: MIIT, 2025 Communications Industry Statistical Bulletin).
Hub-node routing to cheap western power
National hub routing sends new compute to Inner Mongolia, Ningxia, Guizhou and Gansu, where power is about CNY 0.35 per kWh in Hohhot according to the National Energy Administration (July 2025). Those campuses are built new, at AI density, which is why the Western Hub Provinces’ rack spend grows from USD 75.23 million in 2025 to USD 200.63 million in 2035, the region’s 10.31% a year being more than three times the national rate.
Market Trends: How Are Chinese Data Center Racks Changing?
The main shift is from air-cooled to liquid-ready frames, whose share of rack value rises from 27.58% in 2025 to 62.38% in 2035, DC Market Insights estimates.
Liquid cooling moves into the cabinet frame
Sugon Data Energy reported immersion liquid-cooling revenue of RMB 457.9 million in 2025, up 370.58%, and cold-plate revenue of RMB 298.6 million, up 40.01%, in its 2025 annual report. ZTE’s 2025 annual report says its cold-plate and immersion products are now on sale at scale and its data center products are deployed across more than 300,000 racks. A liquid-ready frame carries manifold brackets, drip trays and heavier load ratings, which DC Market Insights prices at a 20% to 40% premium over an air-cooled cabinet of the same height.
Air-cooled cabinets push to 50 kW before giving way
Huawei Digital Power showed the FusionModule2000 at 50 kW per rack with air cooling in October 2025 (Source: Huawei Digital Power), while Kehua Data’s liquid-cooled POD runs 40 kW to 120 kW per cabinet at a power usage effectiveness (PUE) as low as 1.15, according to Kehua’s 2025 annual report. The overlap between 40 kW and 50 kW is where Chinese buyers choose between a deeper air-cooled cabinet and a liquid-ready frame.
Taller racks win the floor
Cabinets of 48U and above take 50.44% of 2025 value and 70.36% of 2035 value, because AI rack-scale systems and power-shelf designs need the extra height; 42U and below shrinks 3.10% a year.
Market Challenges: What Holds Rack Spending Back in China?
Density is the main brake: it cuts the number of new conventional cabinets from 268,667 in 2025 to 216,000 in 2035, DC Market Insights estimates.
Fewer racks per megawatt
At 6 kW per rack a conventional MW needs about 167 cabinets; at 10 kW in 2035 it needs 100. Standard-cabinet value therefore falls 0.78% a year, from USD 264.42 million in 2025 to USD 244.54 million in 2035, even while hall capacity grows.
Occupancy rules slow new large sites
The National Development and Reform Commission (NDRC) green data center plan of July 2024 says no new data center clusters or large sites should be planned where occupancy is below 50%, and sets an occupancy floor of 60% overall. MIIT’s 2026 green computing notice asks recommended facilities for at least 3,000 standard racks and at least 60% occupancy. Rack orders follow occupied halls, so slow-filling regions order cabinets in smaller batches.
Market Opportunities: Where Can Rack Suppliers Win in China?
Two pools add USD 475.11 million of yearly rack spend between 2025 and 2035, DC Market Insights estimates.
Liquid-ready retrofits and new frames worth USD 595.98 million by 2035
Liquid-ready racks grow from USD 172.94 million in 2025 to USD 595.98 million in 2035. Suppliers that ship frames already fitted for cold-plate manifolds avoid on-site rework that hyperscale buyers now refuse.
A replacement wave worth USD 127.36 million a year by 2035
China’s installed IT load grows from about 19,021 MW at the start of 2025 to about 56,603 MW at the start of 2035 in the DC Market Insights model, and 2.5% of that base is re-racked each year, lifting replacement spend from USD 75.29 million to USD 127.36 million.
Pricing: How Much Does a Data Center Rack Cost in China?
A standard 42U-47U data center cabinet cost about USD 950 (about CNY 6,840 at CNY 7.2 per USD) in China in 2025, while an AI rack-scale cabinet cost about USD 9,000, DC Market Insights estimates.
| Price point | 2020 | 2025 | 2030 | 2035 |
|---|---|---|---|---|
| Standard cabinet (USD per rack) | 1,000 | 950 | 920 | 900 |
| AI rack-scale cabinet (USD per rack) | 3,000 | 9,000 | 14,000 | 16,500 |
| Standard cabinet kW per rack | 4.5 | 6.0 | 8.0 | 10.0 |
| AI cabinet kW per rack | 15 | 30 | 70 | 100 |
| Standard rack spend per MW (USD) | 222,222 | 158,333 | 115,000 | 90,000 |
| AI rack spend per MW (USD) | 200,000 | 300,000 | 200,000 | 165,000 |
Rack spend per MW is the better buying metric: an AI hall spends about USD 300,000 per MW on cabinets in 2025 against USD 158,333 for a conventional hall, but by 2035 the AI figure falls to USD 165,000 as 100 kW racks spread the frame over more load. Public anchors: Kehua Data’s data center products line earned RMB 2,239.0 million in 2025, up 16.54%, and the company had delivered more than 2,000 all-in-one cabinets, according to its 2025 annual report.
Standards and Regulation: Which Rules Shape Data Center Racks in China?
Five national rules shape rack choices in China, led by MIIT’s September 2026 requirement that recommended green computing facilities hold at least 3,000 standard racks at 60% occupancy (Source: MIIT, national green computing facility notice).
- MIIT New Data Center Development Three-Year Action Plan (2021): rack scale to grow about 20% a year to 2023, new large sites below PUE 1.3, and steady increases in power per rack (Source: MIIT, July 2021).
- NDRC green data center special action plan (July 2024): new large sites at PUE 1.25 or below, 60% overall occupancy and no new large sites where occupancy is below 50% (Source: NDRC).
- GB 40879 energy efficiency limits for data centers: MIIT’s 2026 green computing notice asks for Grade 2 or better (Source: MIIT, September 2026).
- Beijing PUE surcharge: CNY 0.2 per kWh on the share of power above the PUE limit (Source: Beijing Municipal Government, November 2024).
- National hub node and cluster plan: 8 hub nodes and 10 data center clusters approved in 2022 (Source: NDRC, March 2022).
Market Segmentation: Which China Data Center Rack Types Carry the Value?
AI rack-scale cabinets carry 47.28% of 2025 China rack value, DC Market Insights estimates, even though they are only 8.6% of cabinets shipped.
By Rack Type
| Rack Type | 2025 (USD million) | Share 2025 | 2035 (USD million) | CAGR 2025-2035 |
|---|---|---|---|---|
| Enclosed Server Cabinets | 264.42 | 42.18% | 244.54 | -0.78% |
| AI Rack-Scale Cabinets | 296.40 | 47.28% | 633.60 | 7.89% |
| Open Frame Racks | 39.66 | 6.33% | 45.05 | 1.28% |
| Network and Edge Enclosures | 26.44 | 4.22% | 32.18 | 1.98% |
By Cooling Readiness
Liquid-ready racks are the fastest segment at 13.17% a year because 90% of AI cabinets ship liquid-ready by 2035.
| Cooling Readiness | 2025 (USD million) | Share 2025 | 2035 (USD million) | CAGR 2025-2035 |
|---|---|---|---|---|
| Air-Cooled Racks | 453.99 | 72.41% | 359.38 | -2.31% |
| Liquid-Ready Racks | 172.94 | 27.58% | 595.98 | 13.17% |
By Rack Height
| Rack Height | 2025 (USD million) | Share 2025 | 2035 (USD million) | CAGR 2025-2035 |
|---|---|---|---|---|
| 42U and Below | 211.54 | 33.74% | 154.44 | -3.10% |
| 43U to 47U | 99.16 | 15.82% | 128.70 | 2.64% |
| 48U and Above | 316.23 | 50.44% | 672.21 | 7.83% |
By End User
Cloud and internet companies buy the most racks because they build most of China’s AI halls.
| End User | 2025 (USD million) | Share 2025 | 2035 (USD million) | CAGR 2025-2035 |
|---|---|---|---|---|
| Cloud and Internet Companies | 288.39 | 46.00% | 496.79 | 5.59% |
| Telecom Operators | 150.46 | 24.00% | 191.07 | 2.42% |
| Third-Party Colocation | 112.85 | 18.00% | 171.96 | 4.30% |
| Government and Enterprise | 75.23 | 12.00% | 95.54 | 2.42% |
DC Exclusive: The China Rack Density Ladder, Rack Spend per MW from 3 kW to 400 kW
The China Rack Density Ladder is a DC Market Insights model built from 8 inputs (published rack densities from Huawei, Kehua and Sugon, the 20 kW air-cooling limit in Sugon Data Energy’s filing, and DC Market Insights cabinet prices); it shows that rack spend per MW peaks at about USD 300,000 for 30 kW liquid-ready AI cabinets and falls to about USD 150,000 at 80 kW and above.
| Rack class | kW per rack | Racks per 10 MW | Price per rack | Rack spend per MW |
|---|---|---|---|---|
| Telecom edge enclosure | 3 | 333 | USD 600 | USD 200,000 |
| Standard cabinet, air | 6 | 167 | USD 950 | USD 158,333 |
| Deep cabinet, air (FusionModule class) | 20 | 50 | USD 2,400 | USD 120,000 |
| Liquid-ready AI cabinet | 30 | 33 | USD 9,000 | USD 300,000 |
| Liquid POD cabinet (Kehua class) | 80 | 13 | USD 12,000 | USD 150,000 |
| Supernode cabinet (scaleX640 class) | 400 | 3 | USD 60,000 | USD 150,000 |
The ladder explains the market’s shape: Chinese AI halls in 2025 sit on the most expensive rung, but every move to denser liquid PODs and supernodes lowers spend per MW. Prices above USD 950 are DC Market Insights estimates; no Chinese vendor publishes cabinet list prices.
Regional Insights: Which Chinese Regions Buy the Most Data Center Racks?
The Yangtze River Delta leads with USD 188.08 million of 2025 rack spend, and the Western Hub Provinces grow fastest at 10.31% a year, DC Market Insights estimates.
| Region | 2025 (USD million) | Share 2025 | 2035 (USD million) | CAGR 2025-2035 |
|---|---|---|---|---|
| Beijing-Tianjin-Hebei and North China | 169.27 | 27.00% | 229.29 | 3.08% |
| Yangtze River Delta | 188.08 | 30.00% | 248.39 | 2.82% |
| Guangdong-Hong Kong-Macao Greater Bay Area | 119.12 | 19.00% | 152.86 | 2.53% |
| Chengdu-Chongqing and Central China | 75.23 | 12.00% | 124.20 | 5.14% |
| Western Hub Provinces | 75.23 | 12.00% | 200.63 | 10.31% |
Yangtze River Delta
Shanghai, Jiangsu, Zhejiang and the Wuhu cluster in Anhui spend USD 188.08 million in 2025; Wuhu grows 11.79% a year as the delta’s hub cluster.
Beijing-Tianjin-Hebei and North China
The region spends USD 169.27 million in 2025. Beijing’s CNY 0.2 per kWh PUE surcharge pushes new builds to Zhangjiakou and Langfang in Hebei, which grow 5.30% a year against 0.16% for Beijing.
Guangdong-Hong Kong-Macao Greater Bay Area
Guangdong is the largest single province at USD 106.58 million in 2025, driven by internet company halls in Guangzhou, Shenzhen and the Shaoguan hub.
Chengdu-Chongqing and Central China
Sichuan and Chongqing spend USD 75.23 million in 2025 and grow 5.14% a year on hydropower-backed hubs.
Western Hub Provinces
Inner Mongolia, Ningxia, Guizhou and Gansu spend USD 75.23 million in 2025 and USD 200.63 million in 2035; Ningxia (Zhongwei) grows 13.11% a year, the fastest province.
Province Analysis: Which Provinces Lead China Data Center Rack Demand?
Guangdong leads with USD 106.58 million of 2025 rack spend, and Inner Mongolia (Horinger) is the fastest large province at 11.15% a year, DC Market Insights estimates.
| Rank | Province | Region | 2025 (USD million) | 2035 (USD million) | CAGR 2025-2035 |
|---|---|---|---|---|---|
| 1 | Guangdong | Guangdong-Hong Kong-Macao Greater Bay Area | 106.58 | 133.75 | 2.30% |
| 2 | Beijing | Beijing-Tianjin-Hebei and North China | 75.23 | 76.43 | 0.16% |
| 3 | Hebei (Zhangjiakou and Langfang) | Beijing-Tianjin-Hebei and North China | 62.69 | 105.09 | 5.30% |
| 4 | Shanghai | Yangtze River Delta | 59.56 | 71.65 | 1.87% |
| 5 | Jiangsu | Yangtze River Delta | 53.29 | 66.88 | 2.30% |
| 6 | Zhejiang | Yangtze River Delta | 40.75 | 52.54 | 2.57% |
| 7 | Sichuan | Chengdu-Chongqing and Central China | 28.21 | 47.77 | 5.41% |
| 8 | Inner Mongolia (Horinger) | Western Hub Provinces | 28.21 | 81.21 | 11.15% |
| 9 | Guizhou (Gui’an) | Western Hub Provinces | 25.08 | 52.54 | 7.68% |
| 10 | Chongqing | Chengdu-Chongqing and Central China | 18.81 | 33.44 | 5.92% |
| 11 | Anhui (Wuhu) | Yangtze River Delta | 12.54 | 38.21 | 11.79% |
| 12 | Ningxia (Zhongwei) | Western Hub Provinces | 12.54 | 42.99 | 13.11% |
Forecast Scenarios: How Far Could China Rack Spending Go by 2035?
The base case reaches USD 955.36 million by 2035, within a range of USD 764.29 million to USD 1.17 billion, DC Market Insights estimates.
| Scenario | 2035 (USD million) | CAGR 2025-2035 | Assumption |
|---|---|---|---|
| Low | 764.29 | 2.00% | Supernode cabinets above 100 kW spread faster; new capacity stays near 4,500 MW a year |
| Base | 955.36 | 4.30% | New IT capacity 6,000 MW in 2035, AI share 64% |
| High | 1,165.54 | 6.40% | Liquid-ready frames carry a 40% premium; replacement rate rises to 3.5% |
Competitive Insights: Who Supplies Data Center Racks in China?
The top five suppliers hold about 41% of 2025 China rack value, a DC Market Insights estimate based on rack-scale system share and published cabinet deliveries.
- Huawei (FusionModule cabinets and modules)
- Inspur Electronic Information
- ZTE
- Sugon and Sugon Data Energy
- Foxconn Industrial Internet (FII)
- Kehua Data
- H3C
- Lenovo
- Vertiv
- Schneider Electric
- Rittal
- Delta Electronics
- Invt (Shenzhen INVT Electric)
- Eaton
- Legrand (Minkels and Raritan)
Chinese system makers sell racks inside integrated AI systems: Foxconn Industrial Internet’s cloud computing revenue was RMB 602.68 billion in 2025, up 88.70%, according to its 2025 annual report, and Inspur Electronic Information reported revenue of RMB 164.78 billion, up 43.25%. ZTE’s government and enterprise revenue reached RMB 37.22 billion in 2025, up 100.49%, according to ZTE’s 2025 annual report. Foreign suppliers compete on standard cabinets; Vertiv reported Asia Pacific net sales of USD 2.02 billion in 2025, up 17.5%, according to its fourth-quarter results, without a China split.
Recent Developments: What Changed in China’s Rack Market in 2025 and 2026?
Six dated events since October 2025 set the direction, each moving the market toward denser, liquid-ready cabinets.
- In September 2026, MIIT and four other ministries set the national green computing facility criteria of at least 3,000 standard racks and 60% occupancy (Source: MIIT).
- In April 2026, the National Data Administration reported more than 13.73 million standard racks in use at the end of 2025 (Source: National Data Administration).
- In April 2026, Kehua Data reported more than 2,000 all-in-one cabinets delivered and 40-120 kW liquid POD cabinets (Source: Kehua Data 2025 annual report).
- In March 2026, ZTE reported its data center products deployed across more than 300,000 racks (Source: ZTE 2025 annual report).
- In January 2026, MIIT reported 938,000 racks serving outside customers, up 108,000 (Source: MIIT).
- In November 2025, Sugon launched the scaleX640 single-cabinet 640-accelerator supernode (Source: Sugon).
Research Methodology: How the Model Counts China’s Racks
The model counts racks bought each year from 16 years of new IT capacity, 4 density paths and 2 price paths, and returns USD 626.93 million for 2025.
Receipt: new IT load of 2,600 MW in 2025 is split 38% AI and 62% conventional (the same inputs as the China Data Center Market model); 988 MW of AI load at 30 kW per rack gives 32,933 AI cabinets at USD 9,000; 1,612 MW at 6 kW gives 268,667 standard cabinets at USD 950; 2.5% of the 19,021 MW installed base is re-racked. Exchange rate: CNY 7.2 per USD.
Three bound checks:
- Ceiling 1: racks are 0.86% of the 2025 China Data Center Market of USD 72.77 billion, inside the 0.5% to 1.5% band typical for cabinet spend.
- Ceiling 2: China is 12.85% of the 2025 global Data Center Racks Market (USD 4.88 billion), close to China’s 12.77% share of global data center spend; the Asia Pacific Data Center Racks Market sets the regional context.
- Floor: MIIT’s 108,000 net new external-service racks in 2025 × USD 950 = USD 102.60 million, below the USD 264.42 million standard-cabinet segment.
Full approach: DC Market Insights research methodology.
Table of contents
- 01Introduction
- 1.1Market Definition
- 1.2Scope: Included and Excluded
- 02Key Market Statistics
- 2.1Market Snapshot, 2025, 2026 and 2035
- 2.2Key Takeaways
- 03Executive Summary
- 3.1Market Size, 2020-2035
- 3.2Growth Outlook
- 04Why Estimates Differ
- 4.1Scope Comparison Table
- 05Market Drivers
- 5.1Supernode Cabinets That Hold 640 Accelerators
- 5.213.73 Million Standard Racks
- 5.3Hub-Node Routing to Western Power
- 06Market Trends
- 6.1Liquid Cooling Moves into the Cabinet Frame
- 6.2Air-Cooled Cabinets at 50 kW
- 6.3Taller Racks Win the Floor
- 07Market Challenges
- 7.1Fewer Racks per Megawatt
- 7.2Occupancy Rules
- 08Market Opportunities
- 8.1Liquid-Ready Frames
- 8.2Replacement Wave
- 09Pricing Analysis
- 9.1Rack Prices and kW per Rack, 2020-2035
- 10Standards and Regulation
- 10.1MIIT Three-Year Action Plan
- 10.2NDRC Green Data Center Plan
- 10.3GB 40879
- 10.4Beijing PUE Surcharge
- 10.5Hub Node and Cluster Plan
- 11Market Segmentation
- 11.1By Rack Type: Enclosed Server Cabinets / AI Rack-Scale Cabinets / Open Frame Racks / Network and Edge Enclosures
- 11.2By Cooling Readiness: Air-Cooled Racks / Liquid-Ready Racks
- 11.3By Rack Height: 42U and Below / 43U to 47U / 48U and Above
- 11.4By End User: Cloud and Internet Companies / Telecom Operators / Third-Party Colocation / Government and Enterprise
- 12DC Exclusive: China Rack Density Ladder
- 12.1Rack Spend per MW by Rack Class
- 13Regional Insights
- 13.1Beijing-Tianjin-Hebei and North China
- 13.2Yangtze River Delta
- 13.3Guangdong-Hong Kong-Macao Greater Bay Area
- 13.4Chengdu-Chongqing and Central China
- 13.5Western Hub Provinces
- 14Province Analysis
- 14.1Guangdong
- 14.2Beijing
- 14.3Hebei (Zhangjiakou and Langfang)
- 14.4Shanghai
- 14.5Jiangsu
- 14.6Zhejiang
- 14.7Sichuan
- 14.8Inner Mongolia (Horinger)
- 14.9Guizhou (Gui'an)
- 14.10Chongqing
- 14.11Anhui (Wuhu)
- 14.12Ningxia (Zhongwei)
- 15Forecast Scenarios
- 15.1Low Case
- 15.2Base Case
- 15.3High Case
- 16Competitive Insights
- 16.1Huawei
- 16.2Inspur Electronic Information
- 16.3ZTE
- 16.4Sugon
- 16.5Foxconn Industrial Internet
- 16.6Kehua Data
- 16.7Vertiv
- 16.8Schneider Electric
- 16.9Rittal
- 17Recent Developments
- 17.12025-2026 Events
- 18Research Methodology
- 18.1Model Receipt
- 18.2Bound Checks
- Fig. 1China Data Center Racks Market Size, 2020-2035 (USD million)
- Table 1Executive Summary Attributes
- Table 2Scope Comparison
- Table 3Rack Prices and kW per Rack, 2020-2035
- Table 4Market by Rack Type
- Table 5Market by Cooling Readiness
- Table 6Market by Rack Height
- Table 7Market by End User
- Table 8China Rack Density Ladder
- Table 9Market by Region
- Table 10Top 12 Provinces
- Table 11Forecast Scenarios, 2035
About this report
Written by Amit Jain and reviewed by Deepti Agrawal, Senior Editor, Research. Figures are built top-down and bottom-up and reconciled before publication, with 2025 as the base year.
Read our methodologyHow we built this
- Historical period2020-2024
- Base year2025
- Forecast period2026-2035
- Sizing approachTop-down + bottom-up
Need more than the report?
Advisory on this market
Due diligence, site selection and market entry work, by the analysts who wrote this report.
See consulting servicesFrequently asked questions
USD 678.32 million in 2026, up 8.20% from USD 626.93 million in 2025, according to DC Market Insights estimates. The market is projected to reach USD 955.36 million by 2035, a CAGR of 4.30% from 2025.
4.30% a year from 2025 to 2035, down from 11.08% in 2020-2025, because rising rack density cuts the number of cabinets needed per megawatt even as Chinese data center capacity keeps growing.
Liquid-ready racks grow fastest at 13.17% a year, from USD 172.94 million in 2025 to USD 595.98 million in 2035, because air cooling tops out near 20 kW per cabinet.
About USD 950 for a standard 42U-47U cabinet and about USD 9,000 for an AI rack-scale cabinet in 2025, DC Market Insights estimates. Rack spend per megawatt is about USD 158,333 in conventional halls and USD 300,000 in AI halls.
More than 13.73 million standard racks (2.5 kW units) were in use at the end of 2025, up from more than 9 million a year earlier, according to the National Data Administration. MIIT counted 938,000 racks serving outside customers.
The Yangtze River Delta leads with USD 188.08 million in 2025 (30.00%). The Western Hub Provinces grow fastest at 10.31% a year as new compute moves to Inner Mongolia, Ningxia and Guizhou.
Guangdong, with USD 106.58 million of rack spend in 2025. Ningxia (Zhongwei) is the fastest-growing province at 13.11% a year, from USD 12.54 million to USD 42.99 million.
Huawei, Inspur Electronic Information, ZTE, Sugon and Foxconn Industrial Internet lead, together holding about 41% of 2025 rack value (DC Market Insights estimate). Kehua Data, H3C, Lenovo, Vertiv, Schneider Electric and Rittal follow.
Because each AI rack-scale cabinet costs about USD 9,000 against USD 950 for a standard one. AI cabinets are 47.28% of 2025 value (USD 296.40 million) though only about 8.6% of cabinets shipped.
USD 678.32 million in 2026 counts rack hardware only. Estimates that add power distribution units, cooling, containment aisles or whole micro-module data centers are several times larger; the earlier DC Market Insights edition priced every rack as a standard cabinet.
Get this report
How do I get the full report?
Request a quote; we reply by email within one business day.
How and when will I receive the report?
By email, within 24-48 business hours of payment.
How can I pay?
Once you accept the quote, we email you a secure payment link.
Can I see a sample first?
Yes. Request a free sample and we will email it to you.
Can the report be tailored to my needs?
Yes. We can add countries, segments or data cuts. Talk to an analyst about the scope you need.
Can I get an invoice or pay against a purchase order?
Write to sales@dcmarketinsights.com and our team will help.