
Japan Data Center Racks Market Size, Share & Forecast to 2035
Market at a glance
The Japan Data Center Racks market was worth USD 124.5 million in 2025 and is forecast to reach USD 153.2 million by 2035, growing at a 18.82% CAGR.
 By Amit Jain, Senior Consultant, ICT & Emerging Technologies
 Reviewed by Deepti Agrawal
Last updated 10 Nov 2026
Base year 2025 PDF + Excel
Key findings
Sakai's Two AI Campuses Pull Liquid-Ready Cabinets Into Kansai
From 42U to Tall, Heavy ORv3 Frames
Fewer Cabinets per Megawatt
Seismic Retrofits of the Installed Base
What is inside the report
- 01How Many Dollars Do Japanese Data Halls Spend on Racks in 2026?
- 02Key Takeaways: Why Does Japan Buy Fewer but Costlier Racks?
- 03Japan Data Center Racks Market Summary: What Did Racks Cost Japan From 2020 to 2035?
- 04What Counts as a Data Center Rack in Japan, and What Is Left Out?
- 05Why Do Japan Rack Market Estimates Differ?
- 06Market Drivers: What Drives Rack Purchases in Japan's Data Halls?
- 07Market Trends: How Are Japanese Rack Designs Changing for AI?
- 08Market Challenges: What Holds Back Rack Spending in Japan?
- 09Market Opportunities: Where Can Rack Suppliers Win New Revenue in Japan?
- 10How Much Does a Data Center Rack Cost in Japan?
- 19chapters
- 2020-2024Historical period
- 2026-2035Forecast period
- —Companies profiled
Segmentation
Full analysis
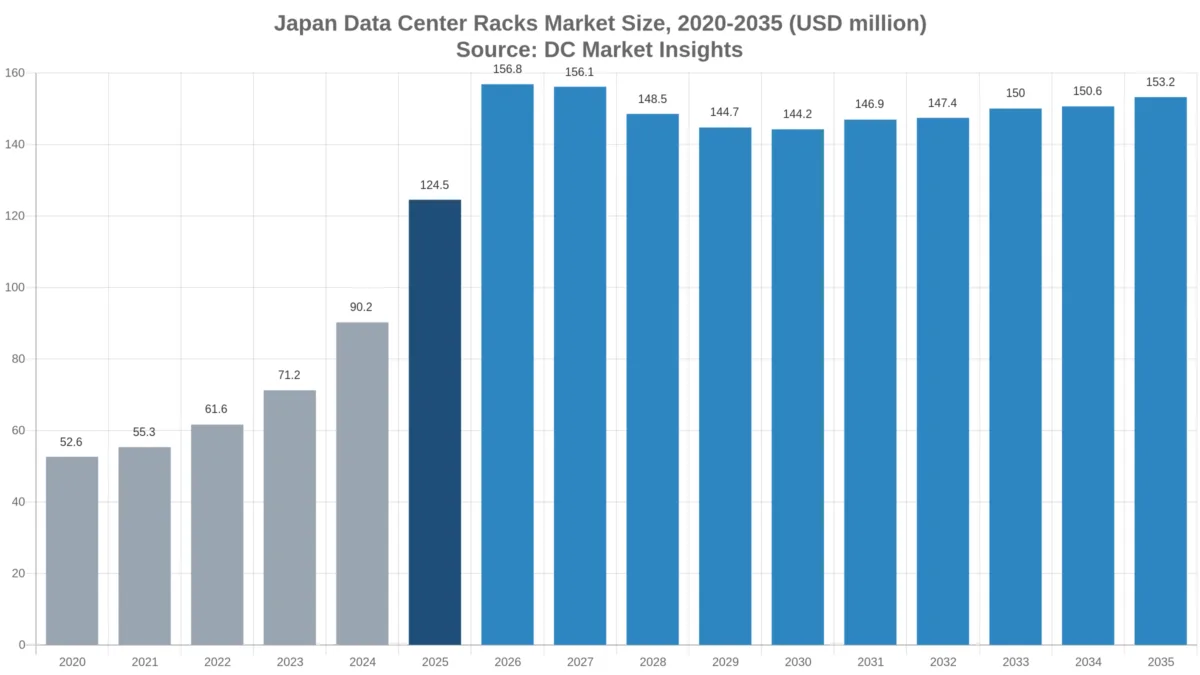
The Japan Data Center Racks Market is valued at USD 156.82 million in 2026 and is projected to reach USD 153.21 million by 2035, up from USD 124.54 million in 2025, a CAGR of 2.09% from 2025 to 2035 (DC Market Insights estimate). The 2025 receipt is 340 MW × USD 0.366 million of racks per MW = USD 124.54 million: 2,975 AI cabinets × USD 12,000 = USD 35.70 million, plus 34,000 standard cabinets × USD 2,000 = USD 68.00 million, plus 7,129 replacement cabinets on the installed base = USD 14.26 million, plus USD 6.58 million of network enclosures and open frames. Japan’s rack spend peaks early because each AI cabinet now carries 40 to 142 kilowatts (kW) of load: when KDDI Corporation (KDDI) switched on its Osaka Sakai site in January 2026 with NVIDIA Corporation (NVIDIA) GB200 NVL72 rack-scale systems and direct liquid cooling (Source: KDDI), one cabinet replaced the work of roughly six to twenty air-cooled 6.5 kW cabinets. The Japan Data Center Racks Market covers the steel frames bought for Japanese data halls: enclosed server cabinets, AI rack-scale cabinets, open frame racks and network and edge enclosures, plus seismic base frames sold with them. Liquid-Ready Racks are the fastest segment at 6.6% a year, and Hokkaido is the fastest region at 12.61% a year because the Watt-Bit policy of the Ministry of Economy, Trade and Industry (METI) steers new halls towards grid-rich sites in the north.
How Many Dollars Do Japanese Data Halls Spend on Racks in 2026?
DC Market Insights values Japan’s data center rack spend at USD 156.82 million in 2026, 25.92% above the USD 124.54 million of 2025, as new IT capacity rises from 340 megawatts (MW) to 470 MW.
- Market size 2025: USD 124.54 million
- Market size 2026: USD 156.82 million
- Market size 2030: USD 144.24 million
- Market size 2035: USD 153.21 million
- CAGR 2025-2035: 2.09% (low case -0.16%, high case 4.14%)
- Largest segment: Enclosed Server Cabinets, 63.41% of 2025 spend
- Fastest segment: Liquid-Ready Racks, 6.6% a year
- Leading region: Kanto, 60.0% of 2025 spend; fastest region: Hokkaido, 12.61% a year
- Largest prefecture: Chiba (Inzai), USD 32.38 million in 2025
- Market leader: Nitto Kogyo, about 16% of 2025 spend (DC Market Insights estimate)
Key Takeaways: Why Does Japan Buy Fewer but Costlier Racks?
- AI cabinets took 28.67% of 2025 spend from only 6.7% of units, because each one costs USD 12,000 against USD 2,000 for a standard cabinet.
- Unit demand falls from 44,104 cabinets in 2025 to 39,657 in 2035, because average density rises from 6.5 kW to 10 kW on air and from 40 kW to 120 kW on liquid.
- Replacement grows from 11.4% to 27.5% of spend by 2035, because the installed base reaches about 5,873 MW and seismic and liquid retrofits re-rack 3.5% of it a year.
- Hokkaido gains 5 points of share by 2035 because METI’s Watt-Bit plan ties new campuses to surplus northern power.
Japan Data Center Racks Market Summary: What Did Racks Cost Japan From 2020 to 2035?
The Japan Data Center Racks Market size was valued at USD 52.58 million in 2020, reached USD 124.54 million in 2025, and is anticipated to reach USD 153.21 million by 2035, at a CAGR of 2.09% during the forecast period.
| Attribute | Value |
|---|---|
| Historical period | 2020-2024 |
| Base year | 2025 |
| Forecast period | 2026-2035 |
| Market size 2025 | USD 124.54 million |
| Market size 2026 | USD 156.82 million |
| CAGR 2025-2035 | 2.09% |
| Market size 2035 | USD 153.21 million |
| CAGR 2020-2025 | 18.82% |
Spending rose 18.82% a year from 2020 to 2025 as AI halls arrived in Inzai and Sakai, then grows 25.92% in 2026 before the density effect flattens it: by 2030 Japan adds 490 MW a year with 26,325 new cabinets, against 43,455 in 2026. The Japan Data Center Racks Market therefore turns into a value-per-cabinet business rather than a unit-count business.
What Counts as a Data Center Rack in Japan, and What Is Left Out?
The Japan Data Center Racks Market covers about 44,104 cabinets and frames bought for Japanese data halls in 2025, worth USD 124.54 million.
Included
- Enclosed 19-inch and Open Rack V3 (ORv3) server cabinets, including seismic base frames and anchoring kits sold with the cabinet
- AI rack-scale cabinets for systems such as NVIDIA GB200 and GB300 NVL72, sold empty or as the frame of an integrated rack
- Open frame racks and network and edge enclosures in data halls, meet-me rooms and telecom edge sites
Excluded
- Servers, GPUs, power distribution units (PDUs), power shelves, busbars and coolant distribution units, even when shipped inside an integrated rack
- Containment, raised floor and cable trays, which belong to facility fit-out
- Office and industrial control enclosures
The boundary with the Japan Data Center Market is simple: that report counts total facility and IT spend, of which racks are well under 1%. The boundary with the Japan Hyperscale Data Center Market is the buyer: hyperscale halls buy 38.0% of racks here, but colocation, telecom and enterprise buyers are also counted.
Why Do Japan Rack Market Estimates Differ?
DC Market Insights values the market at USD 156.82 million in 2026; broader estimates are larger because they add power distribution, containment or the IT gear shipped in an integrated rack.
Some definitions treat a GB200 NVL72 as a “rack” worth several million dollars; here only the frame, about USD 12,000 in 2025, is counted. Others add rack PDUs, cable management, rack-level cooling doors and services, and still others include server rooms in offices and factories. This edition gives no separate breakup by application or by service: frame design service, rack size and frame size choices sit inside the rack type and rack height tables, where rack units (U) define the 42U, 43U to 47U and 48U and above rows. Small and mid-size enterprises remain in scope when they buy racks for their own server rooms that sit in colocation halls.
| Element | In this report | Why |
|---|---|---|
| Cabinet and frame | Yes | The product itself |
| Seismic base frame | Yes | Sold with the cabinet in Japan |
| Rack PDU and power shelf | No | Counted in power distribution reports |
| Servers and GPUs in integrated racks | No | IT hardware, 100 times the frame value |
| Containment and cable trays | No | Facility fit-out |
Market Drivers: What Drives Rack Purchases in Japan’s Data Halls?
New IT capacity drives 83.3% of 2025 rack spend: Japan added about 340 MW in 2025 and 470 MW in 2026, DC Market Insights estimates.
Sakai’s Two AI Campuses Pull Liquid-Ready Cabinets Into Kansai
KDDI opened its Osaka Sakai data center on 22 January 2026 with about 57,000 square meters of floor and direct liquid cooling for GB200 NVL72 racks (Source: KDDI), and SoftBank said in May 2026 that its Sakai AX Factory will be a 140 MW AI data center (Source: SoftBank). At a 60% AI share and 2025 densities, 140 MW means about 2,100 AI cabinets and 8,600 standard cabinets, worth about USD 42.43 million at 2025 prices, DC Market Insights estimates; this is why Kansai grows 3.21% a year while Kanto grows 0.25%.
Hyperscaler Yen Commitments Fund Inzai and Osaka Expansions
Amazon Web Services (AWS) plans to invest JPY 2.26 trillion in its Tokyo and Osaka regions by 2027 (Source: Amazon), Microsoft announced USD 10 billion for Japan for 2026-2029 (Source: Microsoft), and Oracle more than USD 8 billion over ten years (Source: Oracle). Hyperscale Cloud Operators buy USD 47.33 million of racks in 2025 and grow 3.83% a year, the fastest buyer group.
Colocation Halls Rated for 54 MW and 150 kW per Rack
Equinix’s TY12x in Inzai supports up to 54 MW of IT (Source: Equinix), and Digital Realty’s NRT14 supports up to 150 kW per rack on a campus near 100 MW (Source: Digital Realty). Colocation Providers buy 34.0% of racks in 2025 because they fit out halls tenant by tenant.
Market Trends: How Are Japanese Rack Designs Changing for AI?
The average AI cabinet in Japan carries 40 kW in 2025 and 120 kW by 2035, DC Market Insights estimates, and that change reshapes every cabinet spec.
From 42U to Tall, Heavy ORv3 Frames
The Open Compute Project’s Open Rack V3 frame is 600 mm wide, 2,286 mm high and rated for 1,400 kg (Source: Open Compute Project), and a GB300 NVL72 rack needs up to 142 kW (Source: NVIDIA). As a result 48U and Above racks grow from 48.0% to 70.0% of spend by 2035, while 42U and Below falls 5.40% a year.
Containerised Halls in Hokkaido
SAKURA internet Inc. (SAKURA internet) began operating container data centers at Ishikari in June 2025 with about 3.5 megavolt-amperes (MVA) and 40 racks, 20 per container (Source: SAKURA internet), a format that ships racks pre-installed and moves rack demand to the integrator.
Market Challenges: What Holds Back Rack Spending in Japan?
Density is the main brake: cabinet units fall from 44,104 in 2025 to 39,657 in 2035 even though capacity added each year rises 53%.
Fewer Cabinets per Megawatt
A 2020 hall needed about 200 cabinets per MW at 5 kW; a 2035 AI hall needs about 8 at 120 kW. Standard cabinet value falls from USD 68.00 million in 2025 to USD 38.90 million in 2035.
Grid Waits Delay Fit-Out
METI and the Ministry of Internal Affairs and Communications (MIC) set out the Watt-Bit collaboration in June 2025 because power and network connections, not land, now limit new halls (Source: METI). A one-year delay on 100 MW of AI capacity shifts about USD 30 million of cabinet orders to the next year, DC Market Insights estimates.
Market Opportunities: Where Can Rack Suppliers Win New Revenue in Japan?
Liquid-ready cabinets are the largest new pool: USD 40.44 million in 2025, rising to USD 76.66 million by 2035.
Seismic Retrofits of the Installed Base
Japan’s Building Standards Act requires buildings to be safe against earthquake vibration and shock (Source: Ministry of Land, Infrastructure, Transport and Tourism), and halls re-rack about 3.5% of capacity a year; replacement spend rises from USD 14.26 million in 2025 to USD 42.06 million in 2035.
Northern Campuses
Hokkaido’s government tendered a FY2026 programme to attract overseas data centers (Source: Hokkaido Government); Hokkaido rack spend grows from USD 3.74 million to USD 12.26 million.
How Much Does a Data Center Rack Cost in Japan?
A standard enclosed cabinet with a seismic base costs about USD 2,000 in Japan in 2025 and an AI rack-scale cabinet about USD 12,000, DC Market Insights estimates; rack spend per new MW is about USD 0.37 million in 2025.
| Year | Standard cabinet (USD) | AI cabinet (USD) | Standard kW per rack | AI kW per rack | Rack spend per new MW (USD million) |
|---|---|---|---|---|---|
| 2020 | 1,850 | 4,500 | 5.0 | 15 | 0.478 |
| 2025 | 2,000 | 12,000 | 6.5 | 40 | 0.366 |
| 2030 | 2,100 | 18,500 | 8.5 | 90 | 0.294 |
| 2035 | 2,200 | 23,000 | 10.0 | 120 | 0.295 |
At JPY 150 per US dollar, a standard cabinet costs about JPY 300,000 and an AI cabinet about JPY 1.8 million. Prices rise for AI frames because ORv3 frames rated for 1,400 kg need heavier steel, manifold brackets and wider seismic bases.
Which Rules Shape Rack Choices in Japanese Data Centers?
Three rules set rack specs in Japan in 2026: the Building Standards Act on earthquake safety, the Watt-Bit siting policy of June 2025 and METI’s GX Strategy Regions call of August 2025, which includes a data center cluster type (Source: METI).
- Building Standards Act, Article 20: structures must resist earthquake vibration and shock, so cabinets are anchored to seismic base frames (Source: MLIT).
- Watt-Bit collaboration summary 1.0, 12 June 2025: power, network and data center operators plan siting together (Source: METI).
- GX Strategy Regions call, registration 26 August to 27 October 2025, with a data center cluster type (Source: METI).
- Open Rack V3 base specification, revision 1.3 of June 2024, 1,400 kg load rating (Source: Open Compute Project).
Which Rack Type Earns the Most in Japan?
Enclosed Server Cabinets earn the most at USD 78.97 million in 2025, but Liquid-Ready Racks grow fastest at 6.6% a year.
By Rack Type
| Rack Type | 2025 (USD million) | Share 2025 | 2035 (USD million) | CAGR 2025-2035 |
|---|---|---|---|---|
| AI Rack-Scale Cabinets | 35.70 | 28.67% | 65.78 | 6.30% |
| Enclosed Server Cabinets | 78.97 | 63.41% | 77.72 | -0.16% |
| Open Frame Racks | 3.29 | 2.64% | 3.24 | -0.16% |
| Network and Edge Enclosures | 6.58 | 5.28% | 6.48 | -0.16% |
By Cooling Readiness
| Cooling Readiness | 2025 (USD million) | Share 2025 | 2035 (USD million) | CAGR 2025-2035 |
|---|---|---|---|---|
| Liquid-Ready Racks | 40.44 | 32.47% | 76.66 | 6.60% |
| Air-Cooled Racks | 84.10 | 67.53% | 76.55 | -0.94% |
By End User
| End User | 2025 (USD million) | Share 2025 | 2035 (USD million) | CAGR 2025-2035 |
|---|---|---|---|---|
| Hyperscale Cloud Operators | 47.33 | 38.00% | 68.94 | 3.83% |
| Colocation Providers | 42.34 | 34.00% | 50.56 | 1.79% |
| Telecom and GPU Cloud Operators | 14.94 | 12.00% | 18.39 | 2.09% |
| Enterprise and Government | 19.93 | 16.00% | 15.32 | -2.59% |
By Rack Height
| Rack Height | 2025 (USD million) | Share 2025 | 2035 (USD million) | CAGR 2025-2035 |
|---|---|---|---|---|
| 42U and Below | 37.36 | 30.00% | 21.45 | -5.40% |
| 43U to 47U | 27.40 | 22.00% | 24.51 | -1.11% |
| 48U and Above | 59.78 | 48.00% | 107.25 | 6.02% |
DC Exclusive: Japan AI Rack Deployment Tracker, 7 Sites and 224 MW Disclosed
The tracker is a DC Market Insights estimate built on 9 inputs: 7 named sites from company releases, a 60% AI share for new AI campuses and the 2025 densities of 40 kW and 6.5 kW per cabinet. The 224 MW disclosed at SoftBank Sakai, NTT DATA Group Corporation (NTT DATA) OSK11 and Equinix TY12x imply about 17,100 cabinets worth about USD 67.89 million.
| Site | Region | Date | MW | Rack note | Implied cabinets | Implied value (USD million) | Source |
|---|---|---|---|---|---|---|---|
| KDDI Osaka Sakai | Kansai | Jan 2026 | not disclosed | GB200 NVL72, direct liquid cooling | n/a | n/a | KDDI |
| SoftBank Sakai AX Factory | Kansai | 2026 onward | 140 | AI data center | 10,715 | 42.43 | SoftBank |
| SAKURA internet Ishikari containers | Hokkaido | Jun 2025 | 3.5 MVA | 40 racks, 20 per container | n/a | n/a | SAKURA internet |
| NTT DATA Keihanna OSK11 | Kansai | Apr 2026 | 30 | 14th NTT DATA site in Japan | 2,296 | 9.09 | NTT DATA |
| Equinix TY12x Inzai | Kanto | 2026 | 54 | colocation | 4,133 | 16.37 | Equinix |
| Digital Realty NRT14 Inzai | Kanto | 2026 | campus near 100 | up to 150 kW per rack | n/a | n/a | Digital Realty |
| Microsoft Japan programme | Kanto and Kansai | 2026-2029 | not disclosed | USD 10 billion | n/a | n/a | Microsoft |
SoftBank Sakai alone implies about 2,100 AI cabinets, which is why Osaka holds the third-largest prefecture share and why AI rack-scale value in Kansai grows faster than in Kanto.
Which Region of Japan Buys the Most Data Center Racks?
Kanto buys the most at USD 74.72 million in 2025 (60.0%), and Hokkaido grows fastest at 12.61% a year.
| Region | 2025 (USD million) | Share 2025 | 2035 (USD million) | CAGR |
|---|---|---|---|---|
| Kanto | 74.72 | 60.0% | 76.61 | 0.25% |
| Kansai | 32.38 | 26.0% | 44.43 | 3.21% |
| Hokkaido | 3.74 | 3.0% | 12.26 | 12.61% |
| Kyushu | 4.98 | 4.0% | 9.19 | 6.32% |
| Other Regions of Japan | 8.72 | 7.0% | 10.72 | 2.09% |
Kanto
Inzai in Chiba hosts Equinix TY12x and Digital Realty NRT14; Kanto’s share falls from 60% to 50% as land and grid near Tokyo tighten.
Kansai
Sakai and Keihanna add at least 170 MW of disclosed AI and colocation capacity in 2026, lifting Kansai to 29% by 2035.
Hokkaido
Ishikari and Tomakomai draw campuses to surplus renewable power; Hokkaido moves from 3% to 8% of rack spend.
Kyushu
Fukuoka serves as the western edge and disaster-recovery hub; Kyushu grows 6.32% a year.
Other Regions of Japan
Aichi, Miyagi and Hiroshima hold 7.0% of spend, mostly enterprise and telecom edge sites.
Which Prefectures Lead Japan’s Data Center Rack Spending?
Chiba (Inzai) leads with USD 32.38 million in 2025; Hokkaido (Ishikari and Tomakomai) is the fastest large prefecture at 12.61% a year.
| Rank | Prefecture | Region | 2025 (USD million) | 2035 (USD million) | CAGR |
|---|---|---|---|---|---|
| 1 | Chiba (Inzai) | Kanto | 32.38 | 30.64 | -0.55% |
| 2 | Tokyo | Kanto | 24.91 | 22.98 | -0.8% |
| 3 | Osaka | Kansai | 19.93 | 27.58 | 3.3% |
| 4 | Saitama | Kanto | 7.47 | 10.72 | 3.68% |
| 5 | Kanagawa | Kanto | 7.47 | 9.19 | 2.09% |
| 6 | Kyoto (Keihanna) | Kansai | 6.23 | 9.19 | 3.97% |
| 7 | Hyogo | Kansai | 3.74 | 6.13 | 5.07% |
| 8 | Hokkaido (Ishikari and Tomakomai) | Hokkaido | 3.74 | 12.26 | 12.61% |
| 9 | Fukuoka | Kyushu | 3.74 | 6.89 | 6.32% |
| 10 | Aichi | Other Regions of Japan | 3.74 | 4.60 | 2.09% |
| 11 | Miyagi | Other Regions of Japan | 2.49 | 3.06 | 2.09% |
| 12 | Hiroshima | Other Regions of Japan | 1.25 | 1.53 | 2.09% |
How Could Japan’s Rack Spending in 2035 Diverge From the Forecast?
The 2035 range is USD 122.57 million to USD 186.92 million, around a base case of USD 153.21 million.
| Scenario | 2035 (USD million) | CAGR 2025-2035 | What drives it |
|---|---|---|---|
| Low | 122.57 | -0.16% | Grid waits cut new capacity to 400 MW a year and AI racks reach 140 kW |
| Base | 153.21 | 2.09% | 490-520 MW a year, 120 kW AI racks |
| High | 186.92 | 4.14% | Watt-Bit sites add 650 MW a year and seismic retrofits double |
Who Sells Data Center Racks in Japan, and How Concentrated Is the Market?
Nitto Kogyo, Vertiv and Schneider Electric hold about 38% of 2025 spend together, DC Market Insights estimates, based on cabinet lines, Japanese channel presence and AI cabinet references.
- Nitto Kogyo
- Kawamura Electric
- Vertiv
- Schneider Electric
- Rittal
- nVent
- Eaton
- Legrand
- Panduit
- Fujitsu
- NEC
- Sanwa Supply
- Hewlett Packard Enterprise
- Supermicro
- Foxconn Industrial Internet
Nitto Kogyo reported fiscal 2025 sales of JPY 195,783 million, with its electrical and information infrastructure distribution segment up 7.0% to JPY 59,956 million on data center construction (Source: Nitto Kogyo); about USD 20 million of that segment is data center racks, DC Market Insights estimates. Vertiv reported Asia Pacific net sales of USD 2.02 billion for 2025 and a USD 15.0 billion backlog (Source: Vertiv). Server makers such as Hewlett Packard Enterprise, Supermicro and Foxconn Industrial Internet now ship AI cabinets inside integrated racks, so frame suppliers increasingly sell to them, not to the hall owner.
What Changed for Japan’s Data Center Racks in 2025 and 2026?
Six dated events since June 2025 added at least 224 MW of disclosed capacity and the first 120 kW-class cabinets in Japan.
- In June 2025, SAKURA internet began operating 40-rack container data centers at Ishikari (Source: SAKURA internet).
- In June 2025, METI and MIC published the Watt-Bit collaboration summary 1.0 (Source: METI).
- In January 2026, KDDI opened the Osaka Sakai data center with GB200 NVL72 racks and direct liquid cooling (Source: KDDI).
- In April 2026, Microsoft announced USD 10 billion for Japan for 2026-2029 (Source: Microsoft).
- In April 2026, NTT DATA opened Keihanna OSK11 with 30 MW of IT capacity (Source: NTT DATA).
- In May 2026, SoftBank set its Sakai AX Factory at 140 MW (Source: SoftBank).
Research Methodology: How the Model Sizes Japan’s Rack Spend
The model multiplies 2025 new IT capacity of 340 MW by a 35% AI share, divides by 40 kW and 6.5 kW per cabinet and prices the result at USD 12,000 and USD 2,000, then adds 3.5% of a 1,324 MW installed base re-racked and 8% for network enclosures and open frames: USD 124.54 million.
Inputs: new IT capacity 110 MW (2020), 340 MW (2025), 490 MW (2030), 520 MW (2035); AI share 3%, 35%, 60%, 66%; installed base about 1,637 MW at end-2025 and 5,873 MW at end-2035 with 2% retirement a year. Bound checks: (1) rack spend is 3.3% of 340 MW × USD 11.2 million per MW of hall cost, a ceiling; (2) it is 31% of Nitto Kogyo’s JPY 59,956 million infrastructure segment at JPY 150 per USD, a ceiling; (3) the 140 MW SoftBank Sakai campus alone implies USD 42.43 million of cabinets, a floor for 2026-2027. The model follows the China Data Center Racks Market and the Data Center Racks Market; see the research methodology.
Table of contents
- 01How Many Dollars Do Japanese Data Halls Spend on Racks in 2026?
- 1.1Market Snapshot, 2025, 2026 and 2035
- 1.2Key Market Statistics
- 02Key Takeaways: Why Does Japan Buy Fewer but Costlier Racks?
- 2.1AI Cabinet Value Share
- 2.2Unit Decline
- 2.3Replacement Spend
- 2.4Hokkaido Share
- 03Japan Data Center Racks Market Summary: What Did Racks Cost Japan From 2020 to 2035?
- 3.1Market Size 2020-2035
- 3.2CAGR 2020-2025 and 2025-2035
- 04What Counts as a Data Center Rack in Japan, and What Is Left Out?
- 4.1Included
- 4.2Excluded
- 05Why Do Japan Rack Market Estimates Differ?
- 5.1Scope Comparison: Cabinet, Seismic Base, Rack PDU, Integrated IT, Containment
- 06Market Drivers: What Drives Rack Purchases in Japan's Data Halls?
- 6.1Sakai's Two AI Campuses Pull Liquid-Ready Cabinets Into Kansai
- 6.2Hyperscaler Yen Commitments Fund Inzai and Osaka Expansions
- 6.3Colocation Halls Rated for 54 MW and 150 kW per Rack
- 07Market Trends: How Are Japanese Rack Designs Changing for AI?
- 7.1From 42U to Tall, Heavy ORv3 Frames
- 7.2Containerised Halls in Hokkaido
- 08Market Challenges: What Holds Back Rack Spending in Japan?
- 8.1Fewer Cabinets per Megawatt
- 8.2Grid Waits Delay Fit-Out
- 09Market Opportunities: Where Can Rack Suppliers Win New Revenue in Japan?
- 9.1Seismic Retrofits of the Installed Base
- 9.2Northern Campuses
- 10How Much Does a Data Center Rack Cost in Japan?
- 10.1Cabinet Prices 2020, 2025, 2030 and 2035
- 10.2Rack Spend per New MW
- 11Which Rules Shape Rack Choices in Japanese Data Centers?
- 11.1Building Standards Act, Article 20
- 11.2Watt-Bit Collaboration Summary 1.0
- 11.3GX Strategy Regions Call
- 11.4Open Rack V3 Base Specification
- 12Which Rack Type Earns the Most in Japan?
- 12.1Rack Type: AI Rack-Scale Cabinets
- 12.2Rack Type: Enclosed Server Cabinets
- 12.3Rack Type: Open Frame Racks
- 12.4Rack Type: Network and Edge Enclosures
- 12.5Cooling Readiness: Liquid-Ready Racks
- 12.6Cooling Readiness: Air-Cooled Racks
- 12.7End User: Hyperscale Cloud Operators
- 12.8End User: Colocation Providers
- 12.9End User: Telecom and GPU Cloud Operators
- 12.10End User: Enterprise and Government
- 12.11Rack Height: 42U and Below
- 12.12Rack Height: 43U to 47U
- 12.13Rack Height: 48U and Above
- 13DC Exclusive: Japan AI Rack Deployment Tracker, 7 Sites and 224 MW Disclosed
- 13.1KDDI Osaka Sakai
- 13.2SoftBank Sakai AX Factory
- 13.3SAKURA internet Ishikari
- 13.4NTT DATA Keihanna OSK11
- 13.5Equinix TY12x
- 13.6Digital Realty NRT14
- 13.7Microsoft Japan Programme
- 14Which Region of Japan Buys the Most Data Center Racks?
- 14.1Kanto
- 14.2Kansai
- 14.3Hokkaido
- 14.4Kyushu
- 14.5Other Regions of Japan
- 15Which Prefectures Lead Japan's Data Center Rack Spending?
- 15.1Chiba (Inzai)
- 15.2Tokyo
- 15.3Osaka
- 15.4Saitama
- 15.5Kanagawa
- 15.6Kyoto (Keihanna)
- 15.7Hyogo
- 15.8Hokkaido (Ishikari and Tomakomai)
- 15.9Fukuoka
- 15.10Aichi
- 15.11Miyagi
- 15.12Hiroshima
- 16How Could Japan's Rack Spending in 2035 Diverge From the Forecast?
- 16.1Low Scenario
- 16.2Base Scenario
- 16.3High Scenario
- 17Who Sells Data Center Racks in Japan, and How Concentrated Is the Market?
- 17.1Nitto Kogyo
- 17.2Kawamura Electric
- 17.3Vertiv
- 17.4Schneider Electric
- 17.5Rittal
- 17.6nVent
- 17.7Eaton
- 17.8Legrand
- 17.9Panduit
- 17.10Fujitsu
- 17.11NEC
- 17.12Sanwa Supply
- 17.13Hewlett Packard Enterprise
- 17.14Supermicro
- 17.15Foxconn Industrial Internet
- 17.16Market Concentration
- 18What Changed for Japan's Data Center Racks in 2025 and 2026?
- 18.1June 2025 to May 2026 Events
- 19Research Methodology: How the Model Sizes Japan's Rack Spend
- 19.1Model Inputs
- 19.2Bound Checks
- Fig. 1Japan Data Center Racks Market Size, 2020-2035 (USD million)
- Table 1Japan Data Center Racks Market Attributes
- Table 2Scope Comparison
- Table 3Cabinet Prices and Rack Spend per MW
- Table 4Market by Rack Type, 2025 and 2035
- Table 5Market by Cooling Readiness, 2025 and 2035
- Table 6Market by End User, 2025 and 2035
- Table 7Market by Rack Height, 2025 and 2035
- Table 8Japan AI Rack Deployment Tracker
- Table 9Market by Region, 2025 and 2035
- Table 10Top 12 Prefectures
- Table 11Forecast Scenarios 2035
About this report
Written by Amit Jain and reviewed by Deepti Agrawal, Senior Editor, Research. Figures are built top-down and bottom-up and reconciled before publication, with 2025 as the base year.
Read our methodologyHow we built this
- Historical period2020-2024
- Base year2025
- Forecast period2026-2035
- Sizing approachTop-down + bottom-up
Need more than the report?
Advisory on this market
Due diligence, site selection and market entry work, by the analysts who wrote this report.
See consulting servicesFrequently asked questions
USD 156.82 million in 2026, up 25.92% from USD 124.54 million in 2025, according to DC Market Insights estimates. The market is projected to reach USD 153.21 million by 2035, a CAGR of 2.09% from 2025.
2.09% a year, because AI cabinets carry 40 kW in 2025 and 120 kW by 2035, so Japan needs fewer cabinets per megawatt even as new capacity rises to 520 MW a year.
About 44,104 cabinets in 2025: 2,975 AI cabinets, 34,000 standard cabinets for new halls and 7,129 replacements, DC Market Insights estimates.
About USD 2,000 (JPY 300,000) for a standard cabinet with seismic base and USD 12,000 (JPY 1.8 million) for an AI rack-scale cabinet in 2025, DC Market Insights estimates.
6.6% a year for Liquid-Ready Racks, from USD 40.44 million in 2025 to USD 76.66 million by 2035, driven by direct liquid cooling at sites such as KDDI Osaka Sakai.
60.0% of 2025 spend, or USD 74.72 million, is in Kanto, led by Inzai in Chiba. Hokkaido grows fastest at 12.61% a year.
About 38% of 2025 spend goes to Nitto Kogyo, Vertiv and Schneider Electric together (DC Market Insights estimate). Kawamura Electric, Rittal, nVent, Eaton, Legrand, Panduit, Fujitsu and NEC also compete.
28.67% of 2025 spend came from AI rack-scale cabinets, rising to 42.93% by 2035, as GB300 NVL72 racks draw up to 142 kW each (Source: NVIDIA).
USD 156.82 million in 2026 counts only cabinets and frames; wider estimates add rack power distribution, containment or the servers inside integrated racks, which are 100 times the frame value.
USD 122.57 million to USD 186.92 million is the 2035 range: grid waits cutting new capacity to 400 MW a year give the low case, and Watt-Bit sites adding 650 MW a year give the high case.
Get this report
How do I get the full report?
Request a quote; we reply by email within one business day.
How and when will I receive the report?
By email, within 24-48 business hours of payment.
How can I pay?
Once you accept the quote, we email you a secure payment link.
Can I see a sample first?
Yes. Request a free sample and we will email it to you.
Can the report be tailored to my needs?
Yes. We can add countries, segments or data cuts. Talk to an analyst about the scope you need.
Can I get an invoice or pay against a purchase order?
Write to sales@dcmarketinsights.com and our team will help.