
Data Center Demand Response Energy Management Market Size, Share & Forecast to 2035
Market at a glance
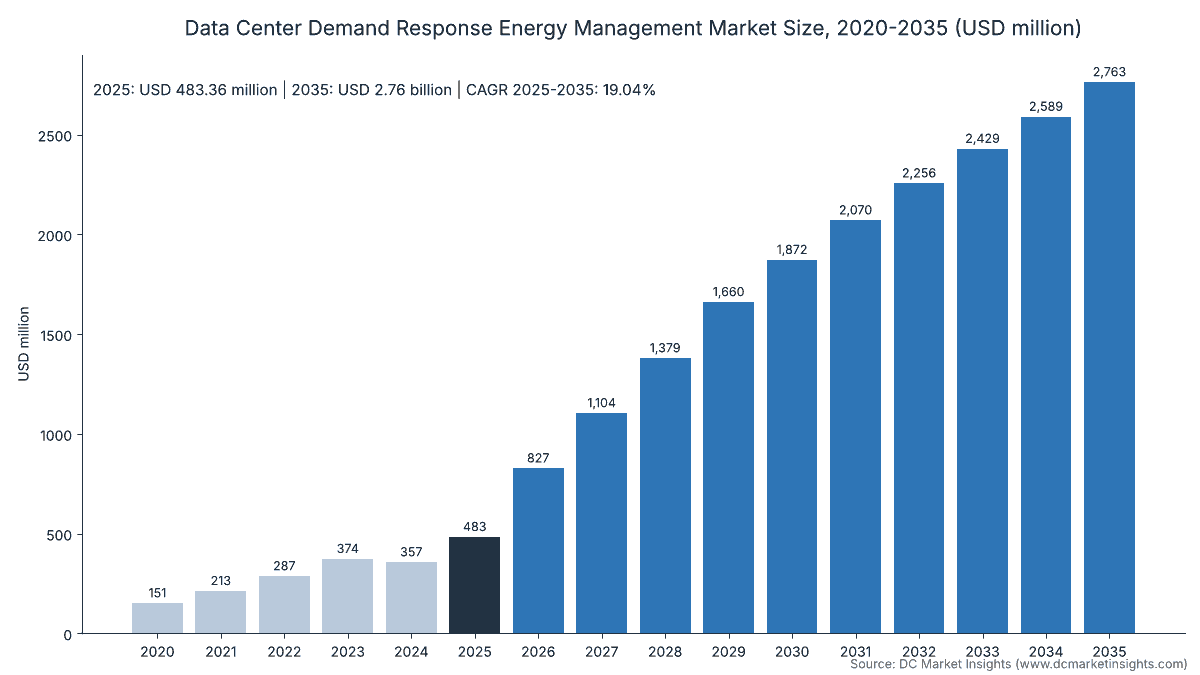
The Data Center Demand Response Energy Management market was worth USD 483.4 million in 2025 and is forecast to reach USD 2,760.0 million by 2035, growing at a 19.04% CAGR.
 By Amit Jain, Senior Consultant, ICT & Emerging Technologies
 Reviewed by Deepti Agrawal
Last updated 5 Nov 2026
Base year 2025 PDF + Excel
Key findings
PJM Puts Unmatched Large Loads First in the Curtailment Queue From January 2026
AI Training Clusters Throttle Instead of Shutting Down: 25% Less Power for 3 Hours in Phoenix
Crypto Mining Earnings Swing With Texas Weather: Riot's Credits Fell 53% in 2024
Flexible Interconnection Agreements Reach USD 773.54 million by 2035
What is inside the report
- 01Introduction
- 02Executive Summary
- 03Market Scope
- 04Market Dynamics
- 05Pricing Analysis
- 06Standards and Regulation
- 07Market Segmentation
- 08DC Exclusive: The Flexible Megawatt Earnings Ladder
- 09Regional Insights
- 10Country Analysis
- 14chapters
- 2020-2024Historical period
- 2026-2035Forecast period
- 11Companies profiled
Segmentation
Companies profiled
- NVIDIA: DSX Flex reference design and GB300 power smoothing
- Google: 1 GW of data center demand response contracts
- Riot Platforms: USD 56.7 million of power curtailment credits in 2025
- TeraWulf: USD 17.7 million of demand response proceeds in 2025
- Bitdeer: 563 MW in use at Rockdale, Texas (March 2026)
- Cipher Mining: USD 7.9 million of ERCOT power sales in 2025
- MARA Holdings: dispatchable mining load in ERCOT
- Eaton: EnergyAware grid-interactive UPS
- Schneider Electric: grid-friendly UPS designs and EPRI DCFlex member
- Vertiv: battery systems linked to CPower's virtual power plant
- Microsoft: grid-interactive UPS at its Dublin data center
Recent developments
Voltus said its PJM capacity programme with Google grew from 100 MW to about 1 GW (Source: Voltus).
the European Commission proposed a data centre rating scheme for sites above 500 kW that includes grid contribution (Source: European Commission).
Emerald AI raised USD 150 million at a USD 1.05 billion valuation (Source: Emerald AI).
FERC ordered six grid operators to address transmission service for flexible large loads (Source: FERC).
Google reported 1 GW of data center demand response capacity under contract (Source: Google).
the PJM board placed unmatched large loads ahead of pre-emergency demand response in curtailment order (Source: PJM).
Full analysis
The Data Center Demand Response Energy Management Market is valued at USD 827.38 million in 2026 and is projected to reach USD 2.76 billion by 2035, up from USD 483.36 million in 2025, a CAGR of 19.04% from 2025 to 2035 (DC Market Insights estimate). The money in this market is set by grid operators deciding who gets switched off first: on 16 January 2026 the PJM Interconnection board ruled that new large loads without matching new capacity are curtailed before pre-emergency demand response, which turns flexibility from a side income into a condition of connection. Texas went the same way through Senate Bill 6 (2025), which sets a 75 MW large-load threshold and requires those loads to curtail or run backup generation in emergencies. On the buyer side, Google reported 1 gigawatt (GW) of data center demand response under utility contracts in March 2026, the first hyperscale programme of that size.
The market covers four streams tied to data center load flexibility: payments operators earn from demand response and grid services, flexibility orchestration software, grid-interactive uninterruptible power supply (UPS) and battery controls, and aggregation, integration and metering services. The 2025 receipt is 6,000 MW of enrolled flexible data center load × USD 42,000 per MW-year = USD 252.00 million in payments, plus USD 231.36 million of software, controls and services. Workload Shifting and Throttling grows fastest at 35.14% a year because artificial intelligence (AI) training jobs can be slowed without a shutdown, and Asia Pacific is the fastest region at 26.77% as Japan, Australia and India write large-load rules.
Key Market Statistics: How Big Is the Data Center Demand Response Energy Management Market in 2026?
The Data Center Demand Response Energy Management Market reaches USD 827.38 million in 2026, 71.17% above the USD 483.36 million of 2025, as hyperscale demand response contracts and PJM curtail-first rules add about 2,500 MW of enrolled load in one year (DC Market Insights estimate).
- Market size 2025: USD 483.36 million
- Market size 2026: USD 827.38 million
- Market size 2030: USD 1.87 billion
- Market size 2035: USD 2.76 billion
- CAGR 2025-2035: 19.04% (low case 13.50%, high case 24.37%)
- Largest component: Demand Response and Grid Service Payments, 52.14% of 2025 value
- Fastest segment: Workload Shifting and Throttling, 35.14% a year
- Leading region: North America, 72.00% of 2025 value; fastest region: Asia Pacific, 26.77%
- Largest country: United States, USD 330.62 million in 2025
- Enrolled flexible data center load: 6,000 MW in 2025, 43,000 MW by 2035
- Largest aggregator of flexible load: Enel, with nearly 5 GW of demand response capacity in North America (Enel North America, September 2025)
Key Takeaways: Why Are Data Centers Being Paid to Use Less Power?
- Payments lead with 52.14% of 2025 value, because grid operators pay about USD 42,000 per enrolled MW-year for the option to cut load.
- Crypto mining data centers earn 55.00% of 2025 value, because they can shut down in minutes; their share falls to 15.00% by 2035 as AI sites take over.
- Hyperscale and AI Data Centers grow 31.72% a year, because utilities now trade faster connection for agreed curtailment.
- Flexible Interconnection Agreements grow 33.35% a year, because FERC ordered six grid operators in June 2026 to justify or create transmission service for flexible large loads.
Executive Summary: What Is the Data Center Demand Response Energy Management Market Worth?
The Global Data Center Demand Response Energy Management Market size was valued at USD 151.30 million in 2020, reached USD 483.36 million in 2025, and is anticipated to reach USD 2.76 billion by 2035, at a CAGR of 19.04% during the forecast period.
| Attribute | Value |
|---|---|
| Historical period | 2020-2024 |
| Base year | 2025 |
| Forecast period | 2026-2035 |
| Market size 2025 | USD 483.36 million |
| Market size 2026 | USD 827.38 million |
| CAGR 2025-2035 | 19.04% |
| Market size 2035 | USD 2.76 billion |
| Segments covered | Component, Flexibility Mechanism, Data Center Type, Program Type |
Growth from 2020 to 2025 ran at 26.15% a year and came mostly from bitcoin mining sites in the Electric Reliability Council of Texas (ERCOT) grid; Riot Platforms alone booked USD 71.2 million of power curtailment credits in 2023 and USD 56.7 million in 2025, according to its annual reports. Growth after 2025 comes from AI campuses, whose operators accept curtailment to get grid capacity years earlier. DC Market Insights expects enrolled flexible data center load to rise from 6,000 MW in 2025 to 23,000 MW in 2030 and 43,000 MW in 2035, about 14% of the installed data center IT base by 2035.
What Does the Data Center Demand Response Energy Management Market Include?
The Data Center Demand Response Energy Management Market counts USD 483.36 million of 2025 spending and earnings that exist only because a data center lets the grid control part of its load.
Included
- Demand response credits, capacity payments, ancillary service revenue and transmission-charge avoidance earned by data center operators (net of aggregator fees).
- Flexibility orchestration software: workload shifting and power-capping platforms, demand response energy management systems and grid-signal integration.
- Grid-interactive UPS firmware, battery management controls, metering and telemetry added so that backup batteries or on-site generators can be dispatched for grid services.
- Aggregation fees, integration engineering and measurement and verification services.
Excluded
- Electricity bills and power purchase agreements, the UPS and battery hardware itself (counted in the Data Center Battery Market), substations and grid connection works (counted in the Data Center Grid Infrastructure Interconnection Market), and building management systems used only for site control.
- Demand response by offices, factories and homes, and virtual power plant capacity that a data center owner buys from other customers to offset its own load.
How the segments fit together
Every enrolled megawatt (MW) carries one payment stream, one software seat and, in the year it joins, one integration job; the four component lines therefore move with enrolled MW. In 2025 the split was 52.14% payments, 22.34% UPS and battery controls, 15.59% services and 9.93% software.
Why Do Data Center Demand Response Energy Management Market Estimates Differ?
The DC Market Insights figure of USD 827.38 million for 2026 counts only flexibility value tied to data center load, so it is smaller than estimates for demand response or energy management as a whole.
Broader definitions add the full value of data center energy management systems and power monitoring, all commercial and industrial demand response, battery energy storage hardware, and power trading margins. Some also count the electricity a data center does not buy during a curtailment, which is a saving on the energy bill rather than a payment. DC Market Insights keeps the payment and the enabling spend and leaves the hardware and the energy bill to sibling reports, so the numbers add up across DC Market Insights reports.
| Element | In this report | Why |
|---|---|---|
| Demand response and grid service payments | Yes, USD 252.00 million in 2025 | Paid only because load is flexible |
| Flexibility software and controls | Yes, USD 156.00 million in 2025 | Bought to make load dispatchable |
| UPS and battery hardware | No | Counted in the battery report |
| Energy bill savings during curtailment | No | Avoided cost, not a market transaction |
| Non-data-center demand response | No | Different buyers |
Small and mid-size colocation operators and enterprise sites are in scope: Enterprise and Edge Data Centers earned USD 48.34 million in 2025, mostly through aggregators that pool sites below the 1 MW minimum of many programmes.
Market Drivers: Why Are Grid Operators Asking Data Centers to Curtail?
Three rule changes between 2025 and 2026 lift the Data Center Demand Response Energy Management Market from USD 483.36 million in 2025 to USD 827.38 million in 2026, by making flexibility a condition of grid access for new data centers.
PJM Puts Unmatched Large Loads First in the Curtailment Queue From January 2026
PJM, the largest United States grid operator, reported that nearly 5,100 MW of the 5,250 MW rise in its 2027/2028 forecast peak came from data centers, and its capacity price cleared at the cap of USD 333.44 per MW-day (PJM auction results, December 2025). The PJM board decided on 16 January 2026 that new large loads without matching new capacity “would be subject to curtailment prior to the deployment of pre-emergency Demand Response”. A curtailable AI campus in PJM therefore has two reasons to sign a flexibility contract: faster connection and capacity value of about USD 121,700 per MW-year at the 2027/2028 price. DC Market Insights puts North American flexibility value at USD 348.02 million in 2025.
Texas Senate Bill 6 Makes 75 MW Loads Curtailable From September 2025
Senate Bill 6 of the 89th Texas Legislature requires the Public Utility Commission of Texas to set a 75 MW threshold and lets ERCOT require large loads “to either deploy the customer’s on-site backup generating facilities or curtail load” in emergencies (Texas Legislature, SB 6 bill analysis). It also creates a reliability service that buys demand reductions from large loads competitively. ERCOT reported about 410 GW of large loads seeking interconnection in March 2026, so even a small share enrolled as controllable load adds thousands of MW to this market.
Ireland’s December 2025 Connection Policy Requires Matching On-Site Generation or Storage
Data centres used 22% of Ireland’s metered electricity in 2024, according to the Central Statistics Office. On 12 December 2025 the Commission for Regulation of Utilities (CRU) decided that new data centres must provide generation or storage matching their requested import capacity, and that this capacity must “participate in the wholesale electricity market” (CRU decision, December 2025). Every new Irish data centre therefore arrives with a dispatchable asset, which supports Ireland’s USD 20.30 million of 2025 market value (DC Market Insights estimate).
Market Trends: How Are Data Centers Making Their Load Flexible?
Flexibility is moving from shutting down whole sites to slowing selected AI jobs, which is why Workload Shifting and Throttling grows from USD 43.50 million in 2025 to USD 884.04 million by 2035.
AI Training Clusters Throttle Instead of Shutting Down: 25% Less Power for 3 Hours in Phoenix
In a May 2025 demonstration reported by NVIDIA, Emerald AI software cut the power of AI workloads on 256 NVIDIA graphics processing units (GPUs) at an Oracle Cloud Infrastructure site in Phoenix by 25% over three hours during a Salt River Project grid peak. Emerald AI raised a USD 150 million Series A at a USD 1.05 billion valuation in August 2026, according to the company, and NVIDIA said in March 2026 that power-flexible AI factories could help free up to 100 GW of capacity across the United States power system. DC Market Insights expects software for this type of flexibility to grow 27.76% a year.
Hyperscalers Sign Utility Demand Response Contracts: Google Reaches 1 GW in March 2026
Google said in August 2025 that agreements with Indiana Michigan Power and the Tennessee Valley Authority were “the first time we’re delivering data center demand response by targeting machine learning (ML) workloads”. By 19 March 2026 it had 1 GW of demand response capacity under long-term contracts, adding Entergy Arkansas, Minnesota Power and DTE Energy. Voltus said in October 2026 that its PJM capacity programme with Google grew from 100 MW to about 1 GW. DC Market Insights values hyperscale and AI flexibility at USD 96.67 million in 2025, rising to USD 1.52 billion by 2035.
UPS Batteries Join Grid Service Markets
Microsoft’s Dublin data center offered its UPS batteries to Ireland’s grid services market through the Enel X aggregator using Eaton EnergyAware UPS units, according to Microsoft (July 2022). In April 2026 Vertiv and CPower agreed to connect Vertiv battery systems at data centers to CPower’s virtual power plant; CPower has paid more than USD 1.4 billion to demand response customers since 2015, according to Vertiv. Battery and UPS Dispatch held 22.00% of 2025 value.
Market Challenges: What Limits Data Center Demand Response Earnings?
Payments per enrolled MW fall from about USD 42,000 in 2025 to about USD 36,000 by 2035 in the DC Market Insights model, because every new flexible campus adds supply to the same programmes.
Crypto Mining Earnings Swing With Texas Weather: Riot’s Credits Fell 53% in 2024
Riot Platforms reported total power curtailment credits of USD 71.2 million in 2023, USD 33.7 million in 2024 and USD 56.7 million in 2025, of which demand response credits were only USD 2.4 million in 2025 (Riot Platforms 10-K, 2025). The rest came from manual curtailment during price spikes, which depends on summer heat. Crypto Mining Data Centers held 55.00% of 2025 value, so the swing in Riot’s credits alone between 2023 and 2024, USD 37.5 million, equals about 8% of the 2025 global market.
Uptime Contracts Limit How Much AI Load Can Be Cut
Colocation and cloud providers sell service levels that allow little downtime, so most flexibility comes from training jobs and backup assets, not from customer-facing inference. The Duke University Nicholas Institute (February 2025) estimated that about 76 GW of new load could join United States grids if it accepted curtailment of 0.25% of its annual hours. DC Market Insights assumes enrolled load reaches only 43,000 MW by 2035, about 14% of the installed base, because of these service limits.
Market Opportunities: Where Will Data Center Flexibility Earn the Most?
The two largest openings, flexible interconnection agreements and software for AI clusters, add USD 1.24 billion of annual value between 2025 and 2035 (DC Market Insights estimate).
Flexible Interconnection Agreements Reach USD 773.54 million by 2035
On 18 June 2026 the Federal Energy Regulatory Commission (FERC) ordered six grid operators to justify their rules or provide “new transmission services for flexible large loads” (FERC, June 2026). FERC’s large-load rulemaking (docket RM26-4, opened 23 October 2025) asks whether curtailable loads should move through interconnection studies faster. DC Market Insights expects Flexible Interconnection Agreements to grow from USD 43.50 million in 2025 to USD 773.54 million by 2035.
Power Smoothing at the Rack Opens a Controls Market Worth USD 312.00 million in 2030
NVIDIA said in July 2025 that GB300 NVL72 racks store 65 joules per GPU in their power supplies and cut peak grid demand by 30% when training a large language model. Grid-interactive UPS and battery controls, which let these buffers and site batteries answer grid signals, reach USD 312.00 million in 2030 as about 4,000 MW of new flexible load is enrolled that year.
Pricing: What Does a Flexible Data Center Megawatt Earn?
An enrolled data center MW earned about USD 42,000 a year in 2025 across programmes, while capacity prices in PJM imply up to USD 121,700 per MW-year when demand response clears at the 2027/2028 price.
| Unit rate (DC Market Insights estimate) | 2020 | 2025 | 2030 | 2035 |
|---|---|---|---|---|
| Payment per enrolled MW-year (USD thousand) | 30.00 | 42.00 | 43.00 | 36.00 |
| Software per enrolled MW-year (USD thousand) | 4.00 | 6.00 | 11.00 | 12.00 |
| UPS and battery controls per new MW (USD thousand) | 110.00 | 90.00 | 78.00 | 70.00 |
Public price anchors: PJM capacity cleared at USD 269.92 per MW-day for 2025/2026, USD 329.17 for 2026/2027, USD 333.44 for 2027/2028 and USD 325 for 2028/2029, according to PJM. Voltus reported paying customers USD 240 million on 8.1 GW of managed capacity in 2025, or about USD 29,600 per MW, which sets the low end of the range.
Standards and Regulation: Which Rules Make Data Centers Curtailable?
At least seven rules adopted or proposed between 2025 and 2026 shape the USD 827.38 million market of 2026, led by curtailment rules in the United States and connection rules in Europe.
- Texas Senate Bill 6 (2025): 75 MW threshold, emergency curtailment or backup generation, competitive demand reduction service (Source: Texas Legislature).
- PJM board decision on large load additions (16 January 2026): curtailment before pre-emergency demand response for loads without matching capacity (Source: PJM).
- FERC docket RM26-4 (October 2025) and show-cause orders to six grid operators (18 June 2026) on flexible large-load transmission service (Source: FERC).
- North American Electric Reliability Corporation (NERC) Reliability Guideline on emerging large loads (1 May 2026) and Level 3 alert (4 May 2026), with a reliability standard targeted for December 2026 (Source: NERC).
- CRU decision on data centre connections (12 December 2025): matching generation or storage that takes part in the wholesale market (Source: CRU).
- European Commission data centre rating scheme proposal (21 September 2026) for sites above 500 kW, including grid contribution (Source: European Commission).
- Great Britain’s Demand Flexibility Service redesign by the National Energy System Operator (9 April 2026), with a 0.1 MW minimum (Source: NESO).
Market Segmentation: Which Segments Lead the Data Center Demand Response Energy Management Market?
Demand Response and Grid Service Payments lead with USD 252.00 million in 2025, while Workload Shifting and Throttling, Hyperscale and AI Data Centers and Flexible Interconnection Agreements grow fastest in their dimensions.
Data Center Demand Response Energy Management Market by Component
| Component | 2025 (USD million) | Share 2025 | 2035 (USD million) | CAGR 2025-2035 |
|---|---|---|---|---|
| Demand Response and Grid Service Payments | 252.00 | 52.14% | 1,548.00 | 19.90% |
| Flexibility Orchestration Software | 48.00 | 9.93% | 556.00 | 27.76% |
| Grid-Interactive UPS and Battery Controls | 108.00 | 22.34% | 280.00 | 10.00% |
| Aggregation Integration and Metering Services | 75.36 | 15.59% | 378.64 | 17.52% |
Flexibility Orchestration Software grows fastest at 27.76% a year because per-MW software spending nearly doubles as AI sites move from on/off curtailment to job-level control.
Data Center Demand Response Energy Management Market by Flexibility Mechanism
| Flexibility Mechanism | 2025 (USD million) | Share 2025 | 2035 (USD million) | CAGR 2025-2035 |
|---|---|---|---|---|
| Load Curtailment and Shutdown | 280.35 | 58.00% | 773.54 | 10.68% |
| Workload Shifting and Throttling | 43.50 | 9.00% | 884.04 | 35.14% |
| Battery and UPS Dispatch | 106.34 | 22.00% | 690.66 | 20.57% |
| On-Site Generation Dispatch | 53.17 | 11.00% | 414.40 | 22.79% |
Load Curtailment and Shutdown falls from 58.00% of value in 2025 to 28.00% in 2035 as bitcoin mining loses share.
Data Center Demand Response Energy Management Market by Data Center Type
| Data Center Type | 2025 (USD million) | Share 2025 | 2035 (USD million) | CAGR 2025-2035 |
|---|---|---|---|---|
| Crypto Mining Data Centers | 265.85 | 55.00% | 414.40 | 4.54% |
| Hyperscale and AI Data Centers | 96.67 | 20.00% | 1,519.45 | 31.72% |
| Colocation Data Centers | 72.50 | 15.00% | 580.15 | 23.12% |
| Enterprise and Edge Data Centers | 48.34 | 10.00% | 248.64 | 17.80% |
Crypto mining sites lead in 2025; Hyperscale and AI Data Centers take the lead by 2029 in the DC Market Insights model. The Crypto Mining Data Center Market explains why mining capacity shrinks in 2026.
Data Center Demand Response Energy Management Market by Program Type
| Program Type | 2025 (USD million) | Share 2025 | 2035 (USD million) | CAGR 2025-2035 |
|---|---|---|---|---|
| Capacity and Reliability Programs | 183.68 | 38.00% | 939.30 | 17.73% |
| Ancillary and Frequency Services | 96.67 | 20.00% | 607.78 | 20.18% |
| Peak and Transmission Charge Avoidance | 159.51 | 33.00% | 442.02 | 10.73% |
| Flexible Interconnection Agreements | 43.50 | 9.00% | 773.54 | 33.35% |
Capacity and Reliability Programs remain the largest programme type at 38.00% of 2025 value, while Peak and Transmission Charge Avoidance shrinks in share as ERCOT four-coincident-peak rules become less important than large-load contracts.
DC Exclusive: The Flexible Megawatt Earnings Ladder, 6 Price Points From USD 29,600 to USD 121,700 per MW-Year
This ladder is a DC Market Insights estimate built on 6 public inputs; it converts published payments and capacity prices into annual earnings per flexible MW so that operators can compare programmes.
| Rung | Programme or operator | Basis | USD per MW-year |
|---|---|---|---|
| 1 | Voltus portfolio average, 2025 | USD 240 million on 8.1 GW | 29,600 |
| 2 | Riot Platforms, Texas, 2025 | USD 56.7 million on about 1,100 MW | 51,500 |
| 3 | TeraWulf, New York, 2025 | USD 17.7 million on 245 MW | 72,200 |
| 4 | PJM capacity, 2025/2026 | USD 269.92 per MW-day × 365 | 98,500 |
| 5 | PJM capacity, 2026/2027 | USD 329.17 per MW-day × 365 | 120,100 |
| 6 | PJM capacity, 2027/2028 | USD 333.44 per MW-day × 365 | 121,700 |
The spread shows why the model uses USD 42,000 per MW-year for 2025: most enrolled data center load earns energy-price and peak-avoidance value (rungs 1 to 3), and only a minority clears capacity markets at rungs 4 to 6. A 100 MW AI campus that moves from rung 2 to rung 5 adds about USD 6.9 million a year.
Regional Insights: Which Region Pays Data Centers Most for Flexibility?
North America leads with 72.00% of 2025 value, and Asia Pacific grows fastest at 26.77% a year to 2035.
North America Data Center Demand Response Energy Management Market
North America earned USD 348.02 million in 2025, 72.00% of value, and grows 16.50% a year to USD 1.60 billion by 2035 (DC Market Insights estimate). Texas and the PJM states hold most enrolled load; Google’s 1 GW of contracts and Riot’s Rockdale (about 700 MW) and Corsicana (about 400 MW) sites are all here.
Europe Data Center Demand Response Energy Management Market
Europe earned USD 72.50 million in 2025, 15.00% of value, and grows 22.52% a year to USD 552.53 million by 2035 (DC Market Insights estimate). Ireland leads because the CRU requires matching generation or storage, and Great Britain’s Demand Flexibility Service accepts sites from 0.1 MW.
Asia Pacific Data Center Demand Response Energy Management Market
Asia Pacific earned USD 38.67 million in 2025, 8.00% of value, and grows 26.77% a year to USD 414.40 million by 2035 (DC Market Insights estimate). The Australian Energy Market Operator expects data centre demand to rise from about 5 TWh in 2025-26 to 34 TWh by 2035-36, about 13% of grid supply, which pushes large-load flexibility rules.
Latin America Data Center Demand Response Energy Management Market
Latin America earned USD 9.67 million in 2025, 2.00% of value, and grows 23.97% a year to USD 82.88 million by 2035 (DC Market Insights estimate). Brazil leads the region; flexibility value is small because few data center campuses exceed 50 MW.
Middle East and Africa Data Center Demand Response Energy Management Market
Middle East and Africa earned USD 14.50 million in 2025, 3.00% of value, and grows 22.52% a year to USD 110.51 million by 2035 (DC Market Insights estimate). Saudi Arabia leads as new AI campuses are designed with on-site generation that can be dispatched.
Country Analysis: Which Countries Lead Data Center Demand Response?
The United States leads with USD 330.62 million in 2025, and India is the fastest large country at 35.87% a year.
| Rank 2025 | Country | Region | 2025 (USD million) | 2035 (USD million) | CAGR 2025-2035 |
|---|---|---|---|---|---|
| 1 | United States | North America | 330.62 | 1,474.14 | 16.12% |
| 2 | Ireland | Europe | 20.30 | 104.98 | 17.86% |
| 3 | United Kingdom | Europe | 15.23 | 116.03 | 22.52% |
| 4 | Canada | North America | 13.92 | 88.13 | 20.27% |
| 5 | Japan | Asia Pacific | 10.83 | 91.17 | 23.75% |
| 6 | Australia | Asia Pacific | 10.05 | 82.88 | 23.48% |
| 7 | Germany | Europe | 9.43 | 93.93 | 25.85% |
| 8 | Netherlands | Europe | 7.25 | 55.25 | 22.52% |
| 9 | Sweden | Europe | 6.53 | 49.73 | 22.52% |
| 10 | Brazil | Latin America | 4.35 | 38.95 | 24.51% |
| 11 | India | Asia Pacific | 3.87 | 82.88 | 35.87% |
| 12 | Saudi Arabia | Middle East and Africa | 3.48 | 35.36 | 26.09% |
India grows fastest because its data center capacity is building out on grids with tight evening peaks; the United Kingdom passes Ireland by 2035 in the model as Irish growth slows under connection limits.
Forecast Scenarios: How Large Could the Data Center Demand Response Energy Management Market Be by 2035?
The Data Center Demand Response Energy Management Market reaches USD 2.76 billion by 2035 in the base case, within a range of USD 1.72 billion to USD 4.28 billion.
| Scenario | Enrolled load 2035 | Payment per MW-year 2035 | Market 2035 | CAGR 2025-2035 |
|---|---|---|---|---|
| Low | 30,000 MW | USD 30,000 | USD 1.72 billion | 13.50% |
| Base | 43,000 MW | USD 36,000 | USD 2.76 billion | 19.04% |
| High | 60,000 MW | USD 42,000 | USD 4.28 billion | 24.37% |
The low case assumes grid operators meet load growth mainly with new generation; the high case assumes FERC and ERCOT flexible-load services become the normal way for AI campuses to connect.
Competitive Insights: Who Leads Data Center Demand Response?
Aggregators Enel, Voltus and CPower handle about 30% of 2025 value together (DC Market Insights estimate), while the largest earners are Texas bitcoin miners and the largest new buyer is Google.
- Enel (Enel North America, Enel X): nearly 5 GW of demand response in North America and more than 9 GW worldwide (September 2025).
- Voltus: 8.1 GW of flexible capacity managed in 2025; about 1 GW PJM programme with Google.
- CPower: more than USD 1.4 billion paid to demand response customers since 2015; partner of Vertiv.
- Emerald AI: AI workload flexibility software; USD 150 million Series A (August 2026).
- NVIDIA: DSX Flex reference design and GB300 power smoothing.
- Google: 1 GW of data center demand response contracts.
- Riot Platforms: USD 56.7 million of power curtailment credits in 2025.
- TeraWulf: USD 17.7 million of demand response proceeds in 2025.
- Bitdeer: 563 MW in use at Rockdale, Texas (March 2026).
- Cipher Mining: USD 7.9 million of ERCOT power sales in 2025.
- MARA Holdings: dispatchable mining load in ERCOT.
- Eaton: EnergyAware grid-interactive UPS.
- Schneider Electric: grid-friendly UPS designs and EPRI DCFlex member.
- Vertiv: battery systems linked to CPower’s virtual power plant.
- Microsoft: grid-interactive UPS at its Dublin data center.
Market shares are DC Market Insights estimates based on disclosed MW and payments; Riot Platforms alone accounted for about 22% of 2025 demand response and grid service payments.
Recent Developments in the Data Center Demand Response Energy Management Market
- In October 2026, Voltus said its PJM capacity programme with Google grew from 100 MW to about 1 GW (Source: Voltus).
- In September 2026, the European Commission proposed a data centre rating scheme for sites above 500 kW that includes grid contribution (Source: European Commission).
- In August 2026, Emerald AI raised USD 150 million at a USD 1.05 billion valuation (Source: Emerald AI).
- In June 2026, FERC ordered six grid operators to address transmission service for flexible large loads (Source: FERC).
- In March 2026, Google reported 1 GW of data center demand response capacity under contract (Source: Google).
- In January 2026, the PJM board placed unmatched large loads ahead of pre-emergency demand response in curtailment order (Source: PJM).
Research Methodology: How DC Market Insights Sized the Data Center Demand Response Energy Management Market
DC Market Insights built the Data Center Demand Response Energy Management Market bottom-up from enrolled flexible data center load: 2,000 MW in 2020, 6,000 MW in 2025, 23,000 MW in 2030 and 43,000 MW in 2035.
Payments = enrolled MW × payment per MW-year (USD 42,000 in 2025, USD 36,000 in 2035). Software = enrolled MW × USD 6,000 per MW-year in 2025 (USD 12,000 in 2035) + USD 10,000 per newly enrolled MW. UPS and battery controls = newly enrolled MW × USD 90,000 in 2025 (USD 70,000 in 2035). Services = 18% of payments + USD 25,000 per newly enrolled MW. Segments, 5 regions and 12 countries are shares of the total that sum to it every year. Read more in our research methodology; building controls are covered in the Data Center Building Management System Market.
Bound checks: (1) ceiling: 6,000 MW enrolled in 2025 is 5.2% of about 116 GW of installed data center IT capacity; (2) ceiling: the USD 42,000 average payment is 43% of the USD 98,500 per MW-year PJM 2025/2026 capacity price; (3) floor: Riot (USD 56.7 million), TeraWulf (USD 17.7 million) and Cipher (USD 7.9 million) together disclosed USD 82.3 million in 2025, 33% of modelled payments of USD 252.00 million.
Table of contents
- 01Introduction
- 1.1Market Definition and Scope
- 1.2Research Methodology
- 02Executive Summary
- 2.1Market Snapshot, 2025, 2026 and 2035
- 2.2Key Market Statistics
- 2.3Key Takeaways
- 03Market Scope
- 3.1Included
- 3.2Excluded
- 3.3How the Segments Fit Together
- 3.4Why Estimates Differ
- 04Market Dynamics
- 4.1Driver: PJM Curtail-First Rule for Large Loads
- 4.2Driver: Texas Senate Bill 6
- 4.3Driver: Ireland Connection Policy
- 4.4Trend: AI Workload Throttling
- 4.5Trend: Hyperscale Demand Response Contracts
- 4.6Trend: UPS Batteries in Grid Service Markets
- 4.7Challenge: Volatile Crypto Mining Earnings
- 4.8Challenge: Uptime Contracts
- 4.9Opportunity: Flexible Interconnection Agreements
- 4.10Opportunity: Rack Power Smoothing Controls
- 05Pricing Analysis
- 5.1Unit Rates 2020, 2025, 2030 and 2035
- 5.2Public Price Anchors
- 06Standards and Regulation
- 6.1United States Rules
- 6.2European Rules
- 07Market Segmentation
- 7.1By Component: Demand Response and Grid Service Payments
- 7.2By Component: Flexibility Orchestration Software
- 7.3By Component: Grid-Interactive UPS and Battery Controls
- 7.4By Component: Aggregation Integration and Metering Services
- 7.5By Flexibility Mechanism: Load Curtailment and Shutdown
- 7.6By Flexibility Mechanism: Workload Shifting and Throttling
- 7.7By Flexibility Mechanism: Battery and UPS Dispatch
- 7.8By Flexibility Mechanism: On-Site Generation Dispatch
- 7.9By Data Center Type: Crypto Mining Data Centers
- 7.10By Data Center Type: Hyperscale and AI Data Centers
- 7.11By Data Center Type: Colocation Data Centers
- 7.12By Data Center Type: Enterprise and Edge Data Centers
- 7.13By Program Type: Capacity and Reliability Programs
- 7.14By Program Type: Ancillary and Frequency Services
- 7.15By Program Type: Peak and Transmission Charge Avoidance
- 7.16By Program Type: Flexible Interconnection Agreements
- 08DC Exclusive: The Flexible Megawatt Earnings Ladder
- 8.16 Price Points per MW-Year
- 09Regional Insights
- 9.1North America
- 9.2Europe
- 9.3Asia Pacific
- 9.4Latin America
- 9.5Middle East and Africa
- 10Country Analysis
- 10.1United States
- 10.2Ireland
- 10.3United Kingdom
- 10.4Canada
- 10.5Japan
- 10.6Australia
- 10.7Germany
- 10.8Netherlands
- 10.9Sweden
- 10.10Brazil
- 10.11India
- 10.12Saudi Arabia
- 11Forecast Scenarios
- 11.1Low Scenario
- 11.2Base Scenario
- 11.3High Scenario
- 12Competitive Insights
- 12.1Enel
- 12.2Voltus
- 12.3CPower
- 12.4Emerald AI
- 12.5NVIDIA
- 12.6Google
- 12.7Riot Platforms
- 12.8TeraWulf
- 12.9Bitdeer
- 12.10Cipher Mining
- 12.11MARA Holdings
- 12.12Eaton
- 12.13Schneider Electric
- 12.14Vertiv
- 12.15Microsoft
- 13Recent Developments
- 13.12026 Developments
- 14Research Methodology
- 14.1Bottom-Up Model
- 14.2Bound Checks
- Fig. 1Data Center Demand Response Energy Management Market Size, 2020-2035
- Table 1Executive Summary Attributes
- Table 2Scope Comparison
- Table 3Unit Rates
- Table 4Market by Component
- Table 5Market by Flexibility Mechanism
- Table 6Market by Data Center Type
- Table 7Market by Program Type
- Table 8Flexible Megawatt Earnings Ladder
- Table 9Top 12 Countries
- Table 10Forecast Scenarios
About this report
Written by Amit Jain and reviewed by Deepti Agrawal, Senior Editor, Research. Figures are built top-down and bottom-up and reconciled before publication, with 2025 as the base year.
Read our methodologyHow we built this
- Historical period2020-2024
- Base year2025
- Forecast period2026-2035
- Sizing approachTop-down + bottom-up
Need more than the report?
Advisory on this market
Due diligence, site selection and market entry work, by the analysts who wrote this report.
See consulting servicesFrequently asked questions
USD 827.38 million in 2026, up 71.17% from USD 483.36 million in 2025, according to DC Market Insights estimates. The market is projected to reach USD 2.76 billion by 2035, a CAGR of 19.04% from 2025.
19.04% a year from 2025 to 2035, after 26.15% a year from 2020 to 2025, as enrolled flexible data center load rises from 6,000 MW to 43,000 MW (DC Market Insights estimate).
About USD 42,000 per enrolled MW-year in 2025 on average (DC Market Insights estimate). PJM capacity prices imply up to USD 121,700 per MW-year for 2027/2028, while Riot Platforms earned USD 56.7 million in 2025.
Demand Response and Grid Service Payments, with USD 252.00 million or 52.14% of 2025 value. Flexibility Orchestration Software grows fastest at 27.76% a year.
Senate Bill 6 (2025) sets a 75 MW large-load threshold and lets ERCOT require those loads to curtail or run backup generation in emergencies. It also creates a service that buys demand reductions from large loads.
On 16 January 2026 the PJM board ruled that new large loads without matching new capacity are curtailed before pre-emergency demand response, so flexibility becomes part of the connection deal for new data centers.
North America, with USD 348.02 million or 72.00% of 2025 value. Asia Pacific grows fastest at 26.77% a year, and India is the fastest large country at 35.87%.
Yes. In May 2025 Emerald AI software cut AI workload power on 256 NVIDIA GPUs by 25% for three hours in Phoenix, and Google reported 1 GW of data center demand response contracts by March 2026.
About 30% of 2025 value passes through Enel, Voltus and CPower (DC Market Insights estimate). Riot Platforms, Google, Emerald AI, NVIDIA, Eaton, Schneider Electric and Vertiv are also active.
The DC Market Insights figure of USD 827.38 million for 2026 counts only flexibility payments and enabling spend tied to data centers. Estimates that add battery hardware, all energy management systems or non-data-center demand response are larger.
Get this report
How do I get the full report?
Request a quote; we reply by email within one business day.
How and when will I receive the report?
By email, within 24–48 business hours of payment.
How can I pay?
Once you accept the quote, we email you a secure payment link.
Can I see a sample first?
Yes. Request a free sample and we will email it to you.
Can the report be tailored to my needs?
Yes. We can add countries, segments or data cuts. Talk to an analyst about the scope you need.
Can I get an invoice or pay against a purchase order?
Write to sales@dcmarketinsights.com and our team will help.