
Singapore Data Center Thermal Management Market Size, Share & Forecast to 2035
Market at a glance
The Singapore Data Center Thermal Management market was worth USD 260.1 million in 2025 and is forecast to reach USD 618.4 million by 2035, growing at a 9.05% CAGR.
 By Amit Jain, Senior Consultant, ICT & Emerging Technologies
 Reviewed by Deepti Agrawal
Last updated 18 Oct 2026
Base year 2025 PDF + Excel
What is inside the report
- 01Introduction
- 02Research Methodology
- 03Executive Summary
- 04Market Dynamics
- 05Pricing
- 06Standards and Regulation
- 07Market Segmentation by Cooling Technology
- 08Market Segmentation by Offering
- 09Market Segmentation by Data Center Type
- 10DC Exclusive: Singapore Liquid-Cooled Capacity Tracker
- 15chapters
- 2020-2024Historical period
- 2026-2035Forecast period
- —Companies profiled
Segmentation
Full analysis
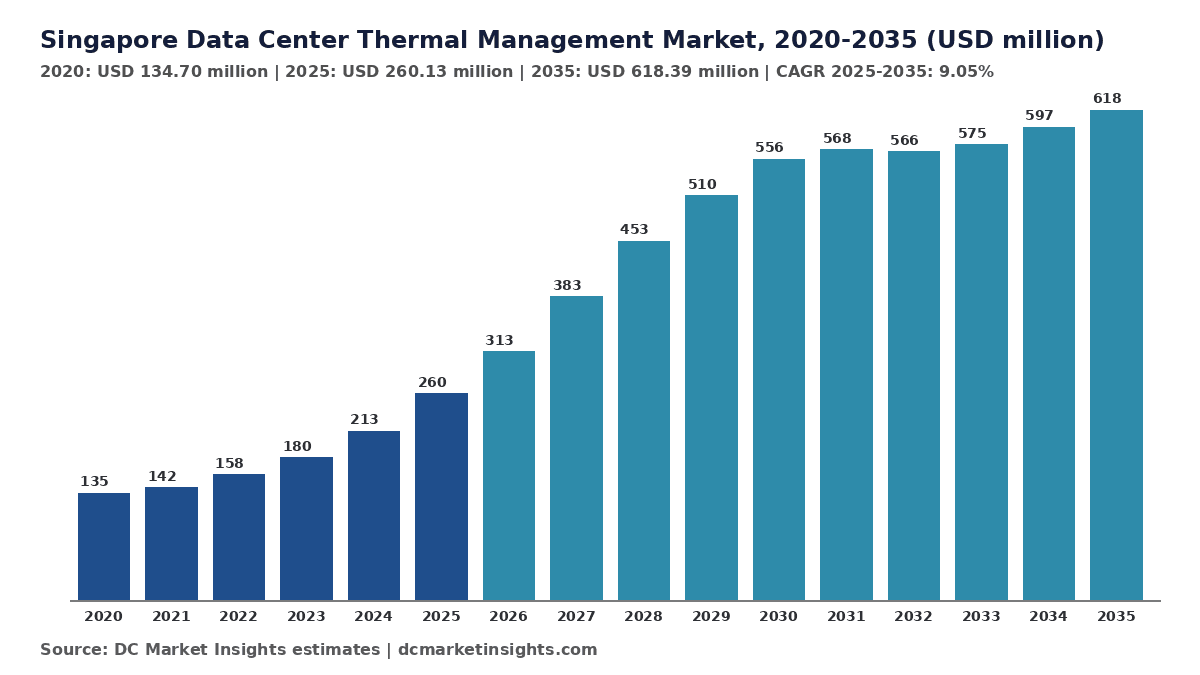
The Singapore Data Center Thermal Management Market is valued at USD 313.29 million in 2026 and is projected to reach USD 618.39 million by 2035, up from USD 260.13 million in 2025, a CAGR of 9.05% from 2025 to 2035 (DC Market Insights estimate). Singapore rations new data center power, and since the second Data Centre Call for Application (DC-CFA2, or CFA2) every new megawatt (MW) it releases must run at a Power Usage Effectiveness (PUE) of 1.25 or better at full IT load, a bar that conventional air cooling in Singapore’s hot, humid climate struggles to meet; in August 2026 the Economic Development Board (EDB) allocated 200 MW on Jurong Island to Digital Realty, Equinix, Keppel Data Centres and ST Telemedia Global Data Centres (STT GDC) on that condition, with liquid cooling named in the selection. That rule moves money from air handlers to liquid loops: in DC Market Insights estimates the Liquid Cooling Systems segment reaches USD 222.62 million by 2035, growing 23.95% a year, the fastest of the five cooling technologies. Singapore Data Center Thermal Management covers the equipment, controls and services that remove heat from Singapore’s data halls, from chiller plants and fan walls to direct-to-chip loops, seawater heat rejection and maintenance contracts. The 2025 build receipt is 62.50 MW of new halls × about USD 2.05 million of cooling per MW = USD 128.15 million, plus 1,100 MW installed × USD 95,000 of service = USD 104.48 million, plus 25 MW of retrofits × USD 1.10 million = USD 27.50 million. The West region, home to Tuas and Jurong Island, is the fastest-growing region at 14.37% a year because the 700 MW Jurong Island data center park sits there.
Key Market Statistics: How Big Is the Singapore Data Center Thermal Management Market in 2026?
DC Market Insights values the Singapore Data Center Thermal Management Market at USD 313.29 million in 2026, 20.44% above the USD 260.13 million of 2025, as Nxera’s 58 MW DC Tuas fills and the first liquid-cooled halls of the DC-CFA pilot are fitted out.
- Market size 2025: USD 260.13 million
- Market size 2026: USD 313.29 million
- Market size 2030: USD 556.50 million
- Market size 2035: USD 618.39 million
- CAGR 2025-2035: 9.05% (low case 6.64%, high case 11.14%)
- Largest cooling technology: Air-Side Cooling and Containment, 40.00% of 2025 spend (USD 104.05 million)
- Fastest segment: Liquid Cooling Systems, 23.95% a year to USD 222.62 million by 2035
- Leading region: East, 38.00% of 2025 spend; fastest-growing region: West, 14.37%
- Largest hub: Tuas, USD 37.46 million in 2025
- Market leader: Vertiv, about 14% of 2025 spend (DC Market Insights estimate)
How Much Do Singapore Data Centers Spend on Cooling and Thermal Management?
Singapore data centers spent USD 260.13 million on thermal management in 2025. The Singapore Data Center Thermal Management Market size was valued at USD 134.70 million in 2020, reached USD 260.13 million in 2025, and is anticipated to reach USD 618.39 million by 2035, at a CAGR of 9.05% during the forecast period. Between 2020 and 2025 the market grew 14.07% a year even though the 2019-2022 moratorium held new completions to about 30-40 MW a year, because the installed base of about 1,100 MW kept buying service, controls and retrofits.
| Report Attribute | Details |
|---|---|
| Historical Period | 2020-2024 |
| Base Year | 2025 |
| Forecast Period | 2026-2035 |
| Singapore Data Center Thermal Management Market Size 2025 | USD 260.13 million |
| Singapore Data Center Thermal Management Market Size 2026 | USD 313.29 million |
| Singapore Data Center Thermal Management Market CAGR (2025-2035) | 9.05% |
| Singapore Data Center Thermal Management Market Size 2035 | USD 618.39 million |
DC Market Insights estimates that new IT capacity completed in Singapore rises from 55 MW in 2025 to 130 MW in 2030 before settling at 110 MW a year by 2035, lifting the market to USD 556.50 million in 2030. Growth slows after 2030 (USD 556.50 million to USD 618.39 million) because the Jurong Island park is largely built out by then and the power the government can release each year stays capped. Thermal management takes about 6.1% of the Singapore Data Center Market in 2025 on the facility-and-services scope used here.
Key takeaways:
- USD 260.13 million in 2025, USD 313.29 million in 2026 and USD 618.39 million by 2035, a 9.05% CAGR, because Singapore releases new capacity only in 80-300 MW tranches.
- Liquid Cooling Systems grow from 10.00% to 36.00% of spend by 2035 because DC-CFA2 capacity must reach PUE 1.25 at full load.
- The West region rises from 36.00% to 58.00% of spend as Jurong Island’s 700 MW park is built.
- Cooling content for a new Singapore hall is about USD 2.00 million per MW of IT load in 2025, in DC Market Insights estimates, because tropical heat rejection needs larger chiller plants.
- Service and retrofit spend on the installed base is USD 131.98 million, or 50.74% of 2025 spend, because about 1,100 MW of older halls must move toward a PUE of 1.3.
What Does Singapore Data Center Thermal Management Cover?
Singapore Data Center Thermal Management covers USD 260.13 million of 2025 spend on removing heat from data halls in Singapore, across five cooling technologies, three offerings and four data center types.
Included
- Chiller plants, cooling towers, dry coolers and heat rejection equipment serving data halls.
- Air-side systems: computer room air handlers (CRAH), fan walls, in-row coolers, rear-door heat exchangers and hot- or cold-aisle containment.
- Liquid cooling: coolant distribution units (CDU), direct-to-chip cold-plate loops, immersion tanks, manifolds and secondary fluid networks, plus the dielectric fluids filled at commissioning.
- District and seawater cooling connections built for data centers.
- Thermal controls: building management system (BMS) cooling modules, data center infrastructure management (DCIM) thermal dashboards, computational fluid dynamics (CFD) modelling and AI set-point optimisation.
- Design consulting, installation, commissioning, retrofits, maintenance and managed cooling contracts.
Excluded
- Electricity bought to run cooling, and the power train (UPS, switchgear, generators).
- Servers’ own fans and heat sinks shipped inside IT equipment.
- Comfort air conditioning for offices inside data center buildings.
- Building shell, land and IT equipment.
How the segments fit together
Every dollar sits once in each of three dimensions (cooling technology, offering and data center type) and once in one of five regions; each split adds up to USD 260.13 million in 2025 and USD 618.39 million in 2035. New-build spend was USD 128.15 million in 2025, service on the installed base USD 104.48 million and liquid and containment retrofits USD 27.50 million.
Why Do Singapore Data Center Thermal Management Market Estimates Differ?
Estimates differ mainly on scope: DC Market Insights puts the 2026 market at USD 313.29 million on a facility-and-services definition, and broader figures add the electricity used for cooling, comfort cooling in office floors or server-level fans. The electricity bill alone would add several times the equipment spend: a 1,100 MW installed base with cooling at about 20% of facility load draws roughly 1.7 terawatt-hours (TWh) a year, worth over USD 250 million at Singapore tariffs (DC Market Insights estimate). The Singapore Data Center Cooling Market covers cooling equipment only; the thermal management scope here adds controls software, design consulting, managed services and district and seawater connections. Small and mid-sized enterprises (SMEs) running server rooms and edge sites are in scope through the Edge and Enterprise and Government segments.
| Element | In this report | Why |
|---|---|---|
| Cooling equipment (chillers, CRAH, CDU, immersion) | Yes (USD 150.88 million in 2025) | Core of the market |
| Installation, retrofit and design consulting | Yes (USD 44.22 million) | Paid to install or change heat removal |
| Maintenance and managed cooling | Yes (USD 65.03 million) | Recurring spend on the installed base |
| Electricity used by cooling | No | An operating cost, not thermal management spend |
| Server fans and heat sinks | No | Part of IT equipment |
| Office comfort cooling | No | Not data hall heat |
Electricity, server fans and comfort cooling are out of scope, so figures that include them run higher than the DC Market Insights estimate.
What Drives Demand for Data Center Cooling in Singapore in 2026?
Three Singapore-specific forces drive the Singapore Data Center Thermal Management Market from USD 260.13 million in 2025 to USD 556.50 million in 2030: rationed capacity tied to efficiency rules, a rising carbon price, and AI racks that air cannot cool.
200 MW of DC-CFA2 capacity on Jurong Island, awarded in August 2026
The EDB provisionally allocated 200 MW to four operators, 50 MW each, in August 2026, and the awardees committed to liquid cooling, 100% energy-efficient IT equipment and Green Mark Platinum, according to the EDB fact sheet of 21 August 2026. At the model’s USD 2.30 million of cooling content per MW for 2028-2030 builds, that capacity alone carries about USD 460 million of thermal management spend, most of it booked between 2027 and 2031. Keppel’s 50 MW Keppel DC SGP 11 targets a PUE under 1.2 with liquid, district and seawater cooling (Source: Keppel SGX filing, August 2026).
A PUE of 1.25 at full IT load, and 1.3 for every existing hall
DC-CFA2 required applicants to reach a PUE of 1.25 at 100% IT load and to draw at least 50% of power from green energy (Source: Infocomm Media Development Authority, IMDA, December 2025), and the Green Data Centre Roadmap of May 2024 aims for all data centers to run at a PUE of 1.3 or lower (Source: IMDA). DC Market Insights estimates that halls built before 2015 typically run above a PUE of 1.5, so the model carries 25 MW of retrofits in 2025 rising to 45 MW a year by 2030, worth USD 56.25 million in 2030.
A carbon tax of S$45 per tonne from 2026
Singapore raised its carbon tax from S$25 to S$45 per tonne of carbon dioxide equivalent (tCO2e) on 1 January 2026 and plans S$50-80 by 2030, according to the National Climate Change Secretariat carbon tax schedule. Each 1°C rise in operating temperature saves 2% to 5% of cooling energy (Source: IMDA), so controls and set-point software that hold halls at 26°C pay back faster as the tax rises; the Thermal Controls and Monitoring Software segment reaches USD 49.47 million by 2035, growing 6.64% a year.
Which Cooling Technologies Are Singapore Operators Adopting Now?
In the Singapore Data Center Thermal Management Market, liquid cooling, warmer halls and seawater heat rejection are the three shifts that take liquid and district systems from 12.00% of spend in 2025 to 42.00% by 2035.
Singapore Standard (SS) 726:2026, the first liquid cooling standard written for tropical data centers
IMDA and Enterprise Singapore published SS 726:2026 Liquid Cooling in Tropical Data Centres in August 2026, covering floor loading, cooling loop design, piping materials and fluid quality, and stating that liquid cooling can cut data center energy use by more than 30% (Source: SS 726:2026 launch release). Nxera’s DC Tuas, opened in February 2026 at 58 MW and a PUE of 1.25, runs Singapore’s largest direct-to-chip deployment (Source: JTC Corporation, JTC).
Immersion trials and the 26°C hall
Keppel and Shell began a 12-month immersion cooling testbed at a Keppel data center in May 2026, with Shell’s benchmarks showing up to 48% better energy efficiency than air cooling (Source: Keppel and Shell immersion cooling release). The SS 697:2023 Tropical Data Centre standard asks operators to move gradually to operating temperatures of 26°C and above (Source: IMDA), which cuts chiller hours and lifts demand for monitoring software.
Seawater and district cooling on reclaimed land
Keppel’s floating data center, under construction since early 2026 (Source: Keppel 1Q 2026 business update), uses closed-loop seawater cooling, and JTC Corporation and Keppel began studying thermal networks for Jurong Island facilities in 2026 (Source: EDB). The District and Seawater Cooling segment reaches USD 37.10 million by 2035, growing 21.71% a year from a small 2025 base.
What Challenges Hold Back Singapore Data Center Cooling Spend?
Two limits keep the Singapore Data Center Thermal Management Market’s growth at 9.05% a year rather than the 14.07% of 2020-2025: capacity rationing and the cost of changing live halls.
New capacity is released in tranches of 80-300 MW
Singapore’s installed capacity exceeds 1.4 gigawatts (GW) across more than 70 data centers (Source: Ministry of Digital Development and Information, February 2026), but new capacity arrives only through calls such as the 80 MW pilot of July 2023 and the 200 MW DC-CFA2 award, and the roadmap promises at least 300 MW in the near term (Source: Green Data Centre Roadmap factsheet). DC Market Insights therefore caps new completions at 110-130 MW a year after 2029, which flattens the market between USD 568.05 million in 2031 and USD 574.70 million in 2033.
Retrofitting live halls costs about USD 1.10 million per MW
Converting a running air-cooled hall to rear-door or direct-to-chip cooling costs about USD 1.10 million per MW in 2025 in DC Market Insights estimates, and the work has to be phased around tenants with 99.99% uptime contracts. Keppel DC REIT (a real estate investment trust) spent about S$9.69 million in 2025 on transformer replacement and chiller and dynamic rotary UPS (DRUPS) overhauls across its portfolio (Source: Keppel DC REIT Sustainability Report 2025), a sign of how slowly owners refresh plant.
Where Are the Revenue Opportunities in Singapore Data Center Thermal Management?
Liquid cooling and managed thermal services add USD 298.55 million to the Singapore Data Center Thermal Management Market of annual spend by 2035, measured against 2025.
Liquid cooling systems: USD 26.01 million to USD 222.62 million
CDUs, cold-plate loops and immersion tanks grow 23.95% a year as DC-CFA2 halls and AI retrofits adopt them. Johnson Controls launched its Silent-Aire CDU line in Singapore in October 2025 with capacities from 500 kilowatts (kW) to over 10 MW (Source: Johnson Controls), and Vertiv agreed to buy fluid-services firm PurgeRite for about USD 1.0 billion in November 2025 (Source: Vertiv).
Maintenance and managed services: USD 65.03 million to USD 166.97 million
Liquid loops need fluid sampling, filtration and flushing that air systems never did, so maintenance and managed services rise from 25.00% to 27.00% of spend. Data hall thermal management consultants, the mechanical engineers and CFD modelling teams who design airflow and liquid loops, earn about 8% of installation and retrofit spend, or about USD 3.5 million in 2025, in DC Market Insights estimates.
How Much Does Data Center Cooling Cost per MW in Singapore?
Singapore data center thermal management for a new hall costs about USD 2.00 million per MW of IT load in 2025, rising to USD 2.70 million by 2035 as liquid loops replace air handlers, in DC Market Insights estimates.
| Price point | 2020 | 2025 | 2030 | 2035 |
|---|---|---|---|---|
| New-build cooling content (USD million per IT MW) | 1.60 | 2.00 | 2.45 | 2.70 |
| Service and controls (USD thousand per installed MW a year) | 75 | 95 | 115 | 130 |
| Liquid or containment retrofit (USD million per MW) | 0.95 | 1.10 | 1.25 | 1.35 |
Public anchors: Equinix put USD 260 million into the 20 MW SG6 facility, about USD 13 million per MW, so cooling at USD 2.00 million is about 15% of that budget (Source: Equinix, November 2024). Schneider Electric contributed about S$5 million of cooling and prefabricated data hall solutions to the Sustainable Tropical Data Centre Testbed 2.0 in March 2026 (Source: National University of Singapore). SP Group cut the household tariff by 10.4%, or 3.32 cents per kilowatt-hour (kWh), for October-December 2026 (Source: SP Group), and lower tariffs lengthen the payback of efficiency retrofits.
Which Rules and Standards Govern Data Center Cooling in Singapore?
Five rules shape the USD 260.13 million Singapore Data Center Thermal Management Market, and the strictest, a PUE of 1.25 at full load, applies to the 200 MW of DC-CFA2 capacity.
- Green Data Centre Roadmap (IMDA, May 2024): at least 300 MW of additional capacity and a PUE target of 1.3 or lower for all data centers.
- DC-CFA2 conditions (IMDA and EDB, December 2025): PUE 1.25 at 100% IT load and at least 50% green energy.
- SS 697:2023 Tropical Data Centre standard: gradual move to 26°C and above, 2% to 5% cooling energy saved per 1°C.
- SS 726:2026 Liquid Cooling in Tropical Data Centres (August 2026): loop design, piping, fluid quality and monitoring.
- BCA-IMDA Green Mark for Data Centre 2024 (October 2024) and the carbon tax of S$45 per tCO2e from 2026.
Which Cooling Segment Leads the Singapore Market, and Which Grows Fastest?
In the Singapore Data Center Thermal Management Market, Air-Side Cooling and Containment leads with 40.00% of 2025 spend (USD 104.05 million), and Liquid Cooling Systems is the fastest-growing segment at 23.95% a year, overtaking air-side systems by 2032.
By Cooling Technology
Chiller plants keep 27.00% of spend in 2035 because liquid loops still reject heat through chillers or dry coolers in a 30°C climate.
| Cooling technology | 2025 (USD million) | Share 2025 | 2035 (USD million) | CAGR 2025-2035 |
|---|---|---|---|---|
| Chiller Plant and Heat Rejection | 98.85 | 38.00% | 166.97 | 5.38% |
| Air-Side Cooling and Containment | 104.05 | 40.00% | 142.23 | 3.17% |
| Liquid Cooling Systems | 26.01 | 10.00% | 222.62 | 23.95% |
| District and Seawater Cooling | 5.20 | 2.00% | 37.10 | 21.71% |
| Thermal Controls and Monitoring Software | 26.01 | 10.00% | 49.47 | 6.64% |
| Total | 260.13 | 100.00% | 618.39 | 9.05% |
By Offering
Equipment is 58.00% of 2025 spend; maintenance and managed services grow fastest at 9.89%.
| Offering | 2025 (USD million) | Share 2025 | 2035 (USD million) | CAGR 2025-2035 |
|---|---|---|---|---|
| Equipment | 150.88 | 58.00% | 346.30 | 8.66% |
| Installation and Retrofit Services | 44.22 | 17.00% | 105.13 | 9.05% |
| Maintenance and Managed Services | 65.03 | 25.00% | 166.97 | 9.89% |
| Total | 260.13 | 100.00% | 618.39 | 9.05% |
By Data Center Type
Colocation holds 56.00% of 2025 spend; Hyperscale and Cloud grows fastest at 11.65% as cloud and AI tenants take DC-CFA capacity.
| Data center type | 2025 (USD million) | Share 2025 | 2035 (USD million) | CAGR 2025-2035 |
|---|---|---|---|---|
| Colocation | 145.67 | 56.00% | 321.56 | 8.24% |
| Hyperscale and Cloud | 78.04 | 30.00% | 234.99 | 11.65% |
| Enterprise and Government | 31.22 | 12.00% | 49.47 | 4.71% |
| Edge | 5.20 | 2.00% | 12.37 | 9.05% |
| Total | 260.13 | 100.00% | 618.39 | 9.05% |
DC Exclusive: The Singapore Liquid-Cooled Capacity Tracker (7 Projects, 303 MW)
Seven named projects add about 303 MW of liquid- or seawater-cooled IT capacity to the Singapore Data Center Thermal Management Market’s base, worth about USD 650 million of thermal management spend at 2026-2030 content prices. The tracker and the region × technology matrix are a DC Market Insights model, estimated from 9 inputs (completions by year, cooling content per MW, service spend per MW, retrofit MW, retrofit price, retirement rate, booking lag, technology shares and region shares) and checked against the source ledger.
| Project | Operator | Location | IT capacity | Cooling design | Status |
|---|---|---|---|---|---|
| DC Tuas | Nxera (Singtel) | Tuas | 58 MW | Direct-to-chip, PUE 1.25 | Opened February 2026 |
| SG6 | Equinix | Singapore (site not disclosed) | 20 MW | Liquid cooling ready | Opening Q1 2027 |
| Keppel DC SGP 11 | Keppel Data Centres | Jurong Island | 50 MW | Liquid, district and seawater, PUE under 1.2 | DC-CFA2, August 2026 |
| DC-CFA2 campus | ST Telemedia Global Data Centres | Jurong Island | 50 MW | Liquid cooling | DC-CFA2, August 2026 |
| DC-CFA2 campus | Digital Realty | Jurong Island | 50 MW | Higher chilled-water temperatures | DC-CFA2, August 2026 |
| DC-CFA2 campus | Equinix | Jurong Island | 50 MW | Liquid cooling | DC-CFA2, August 2026 |
| Floating data center | Keppel | Offshore (site not disclosed) | About 25 MW | Closed-loop seawater | Under construction, 2028 |
Region × Cooling Technology Spend Matrix, 2025 (USD million, DC Market Insights estimate):
| Region | Chiller Plant and Heat Rejection | Air-Side Cooling and Containment | Liquid Cooling Systems | District and Seawater Cooling | Thermal Controls and Monitoring Software | Total |
|---|---|---|---|---|---|---|
| West | 35.59 | 37.46 | 9.37 | 1.87 | 9.37 | 93.65 |
| East | 37.56 | 39.54 | 9.88 | 1.98 | 9.88 | 98.85 |
| Central | 15.82 | 16.65 | 4.16 | 0.83 | 4.16 | 41.62 |
| North | 5.93 | 6.24 | 1.56 | 0.31 | 1.56 | 15.61 |
| North-East | 3.96 | 4.16 | 1.04 | 0.21 | 1.04 | 10.41 |
Which Part of Singapore Leads Data Center Cooling Spend, and Which Grows Fastest?
The East leads the Singapore Data Center Thermal Management Market with 38.00% of 2025 spend (USD 98.85 million), and the West is the fastest-growing region at 14.37% a year, taking 58.00% of spend by 2035 as Jurong Island and Tuas absorb most new capacity.
| Region | 2025 (USD million) | Share 2025 | 2035 (USD million) | CAGR 2025-2035 |
|---|---|---|---|---|
| West | 93.65 | 36.00% | 358.67 | 14.37% |
| East | 98.85 | 38.00% | 148.41 | 4.15% |
| Central | 41.62 | 16.00% | 61.84 | 4.04% |
| North | 15.61 | 6.00% | 30.92 | 7.08% |
| North-East | 10.41 | 4.00% | 18.55 | 5.95% |
West
USD 93.65 million in 2025 to USD 358.67 million by 2035 (14.37% a year). Tuas, Jurong and Jurong Island. Nxera’s 58 MW DC Tuas and all 200 MW of DC-CFA2 capacity sit here, and JTC Corporation says the roughly 20-hectare Jurong Island park can provide up to 700 MW of power (Source: JTC, October 2025).
East
USD 98.85 million in 2025 to USD 148.41 million by 2035 (4.15% a year). Tampines, Loyang, Changi and Paya Lebar host the oldest colocation campuses, including Keppel DC REIT’s Tampines assets, so spend here is mostly service and retrofit.
Central
USD 41.62 million in 2025 to USD 61.84 million by 2035 (4.04% a year). Genting Lane, Kallang and one-north host enterprise and colocation halls in dense urban plots where rooftop space for heat rejection is short; Keppel starts Keppel DC SGP 9 at Genting Lane in mid-2026 (Source: Keppel).
North
USD 15.61 million in 2025 to USD 30.92 million by 2035 (7.08% a year). Woodlands and the northern industrial estates host mid-sized enterprise and government halls.
North-East
USD 10.41 million in 2025 to USD 18.55 million by 2035 (5.95% a year). Serangoon North and Seletar host a handful of enterprise and edge sites.
Which Singapore Data Center Hubs Spend the Most on Cooling?
Tuas leads Singapore data center thermal management spend with USD 37.46 million in 2025, and Jurong Island is the fastest-growing large hub at 52.70% a year, from USD 1.87 million to USD 129.12 million by 2035.
| Rank | Hub | Region | 2025 (USD million) | 2035 (USD million) | CAGR 2025-2035 |
|---|---|---|---|---|---|
| 1 | Tuas | West | 37.46 | 121.95 | 12.53% |
| 2 | Tampines | East | 33.61 | 53.43 | 4.74% |
| 3 | Jurong East and Jurong West | West | 30.90 | 64.56 | 7.65% |
| 4 | Loyang | East | 29.65 | 44.52 | 4.15% |
| 5 | Changi | East | 25.70 | 38.59 | 4.15% |
| 6 | Kranji and Lim Chu Kang | West | 23.41 | 43.04 | 6.28% |
| 7 | Genting Lane and Kallang | Central | 18.73 | 29.68 | 4.71% |
| 8 | one-north and Ayer Rajah | Central | 16.65 | 23.50 | 3.51% |
| 9 | Woodlands | North | 10.93 | 21.64 | 7.08% |
| 10 | Paya Lebar | East | 9.88 | 11.87 | 1.85% |
| 11 | Serangoon North | North-East | 5.72 | 10.20 | 5.95% |
| 12 | Jurong Island | West | 1.87 | 129.12 | 52.70% |
The 12 hubs carry USD 244.51 million of the USD 260.13 million spent in 2025; smaller sites make up the rest. The Singapore AI Data Center Market shows the same westward shift for AI halls.
How Could the 2035 Singapore Data Center Cooling Forecast Change? Three Scenarios
The 2035 Singapore Data Center Thermal Management Market ranges from USD 494.71 million to USD 748.25 million around the base case of USD 618.39 million, depending on how much power Singapore releases after the Jurong Island park.
| Scenario | 2035 (USD million) | CAGR 2025-2035 | What changes |
|---|---|---|---|
| Low case | 494.71 | 6.64% | No capacity call after DC-CFA2; completions fall to 80 MW a year |
| Base case | 618.39 | 9.05% | 110-130 MW a year; liquid cooling 36% of spend |
| High case | 748.25 | 11.14% | A third call of 300 MW plus green-energy imports; liquid cooling over 45% |
Who Are the Leading Data Center Thermal Management Companies in Singapore, and What Is Their Share?
The five largest suppliers hold about 52% of the Singapore Data Center Thermal Management Market in 2025, with Vertiv at about 14%, in DC Market Insights estimates based on equipment installed in Singapore halls and announced project wins.
- Vertiv
- Schneider Electric (with Motivair)
- Daikin (Daikin Applied)
- Trane Technologies (with LiquidStack)
- Johnson Controls (Silent-Aire)
- Carrier
- STULZ
- Mitsubishi Electric
- Rittal
- Kaer
- Keppel (district and seawater cooling)
- Shell (immersion fluids)
- Delta Electronics
Liquid cooling is consolidating the field: Schneider Electric completed a 75% stake in Motivair in February 2025 (Source: Schneider Electric), Daikin Applied agreed to acquire DDC Solutions in August 2025 (Source: Daikin Applied), and Trane Technologies bought the rest of LiquidStack in the first quarter of 2026 (Source: Trane Technologies 10-Q). Kaer, a Singapore cooling-as-a-service provider, sells cooling on a per-kWh basis rather than as equipment, and Keppel combines data center ownership with district cooling. The Data Center Precision Air Conditioning Market gives the global picture for air-side units.
What Changed in Singapore Data Center Cooling in 2025 and 2026?
For Singapore data center thermal management, six dated events since October 2025 put at least 303 MW of new Singapore capacity on liquid or seawater cooling.
- In October 2025, Johnson Controls launched its Silent-Aire coolant distribution units in Singapore, from 500 kW to over 10 MW (Source: Johnson Controls).
- In December 2025, IMDA and EDB opened DC-CFA2 for at least 200 MW, with a PUE of 1.25 at full IT load (Source: IMDA).
- In February 2026, Nxera opened the 58 MW DC Tuas with direct-to-chip liquid cooling and a PUE of 1.25 (Source: JTC Corporation).
- In March 2026, Schneider Electric joined the Sustainable Tropical Data Centre Testbed 2.0 with about S$5 million of solutions (Source: National University of Singapore).
- In April 2026, Keppel and Shell announced a 12-month immersion cooling testbed starting in May 2026 (Source: Keppel).
- In August 2026, the EDB allocated 200 MW on Jurong Island to Digital Realty, Equinix, Keppel Data Centres and STT GDC, and Singapore published SS 726:2026 for liquid cooling (Source: EDB; Enterprise Singapore).
How Did DC Market Insights Build the Singapore Data Center Thermal Management Model? (Methodology)
The model books half of each hall’s cooling spend in its completion year and half in the year before: 27.50 MW × USD 2.00 million plus 35.00 MW × USD 2.09 million gives USD 128.15 million for 2025, then adds USD 104.48 million of service and controls on about 1,100 MW of installed IT load (USD 95,000 per MW) and USD 27.50 million of retrofits (25 MW × USD 1.10 million). Completions are 35 MW (2020), 55 MW (2025), 130 MW (2030) and 110 MW (2035); 1% of the installed base retires each year; the base starts at 960 MW in 2020, in line with the 1,000 MW of IT capacity the government reported for 2021 (Source: Ministry of Trade and Industry). Technology, offering, type and region shares are set for 2025 and 2035, interpolated, and sum to the total every year.
Three bound checks:
- Ceiling 1: the model adds 515 MW of IT capacity over 2026-2030, within the 300 MW roadmap tranche plus 200 MW of DC-CFA2 and the 80 MW pilot (580 MW).
- Ceiling 2: new-build cooling of USD 128.15 million in 2025 is about 19% of the roughly USD 660 million facility budget for 55 MW at USD 12 million per MW.
- Floor: Nxera’s 58 MW DC Tuas at USD 1.60-2.00 million per MW alone implies USD 93-116 million of cooling over 2024-2026, below the model’s USD 387.35 million of new-build spend in those years.
Full approach: DC Market Insights research methodology.
Table of contents
- 01Introduction
- 1.1Market Definition and Scope
- 1.2Included and Excluded Elements
- 1.3How the Segments Fit Together
- 1.4Why Singapore Data Center Thermal Management Market Estimates Differ
- 02Research Methodology
- 2.1Bottom-Up Model: New MW × Cooling Content per MW + Installed MW × Service
- 2.2Bound Checks
- 2.3Source Ledger
- 03Executive Summary
- 3.1Market Snapshot, 2025, 2026 and 2035
- 3.2Key Market Statistics
- 3.3Key Takeaways
- 04Market Dynamics
- 4.1Driver: 200 MW of DC-CFA2 Capacity on Jurong Island
- 4.2Driver: PUE 1.25 at Full IT Load and 1.3 for Existing Halls
- 4.3Driver: Carbon Tax of S$45 per Tonne
- 4.4Trend: SS 726:2026 Liquid Cooling Standard
- 4.5Trend: Immersion Trials and the 26°C Hall
- 4.6Trend: Seawater and District Cooling
- 4.7Challenge: Capacity Released in Tranches
- 4.8Challenge: Retrofit Cost in Live Halls
- 4.9Opportunity: Liquid Cooling Systems
- 4.10Opportunity: Maintenance and Managed Services
- 05Pricing
- 5.1Cooling Cost per MW, 2020-2035
- 5.2Public Price Anchors
- 06Standards and Regulation
- 6.1Green Data Centre Roadmap
- 6.2DC-CFA2 Conditions
- 6.3SS 697:2023 Tropical Data Centre Standard
- 6.4SS 726:2026 Liquid Cooling in Tropical Data Centres
- 6.5Green Mark for Data Centre 2024 and Carbon Tax
- 07Market Segmentation by Cooling Technology
- 7.1Chiller Plant and Heat Rejection
- 7.2Air-Side Cooling and Containment
- 7.3Liquid Cooling Systems
- 7.4District and Seawater Cooling
- 7.5Thermal Controls and Monitoring Software
- 08Market Segmentation by Offering
- 8.1Equipment
- 8.2Installation and Retrofit Services
- 8.3Maintenance and Managed Services
- 09Market Segmentation by Data Center Type
- 9.1Colocation
- 9.2Hyperscale and Cloud
- 9.3Enterprise and Government
- 9.4Edge
- 10DC Exclusive: Singapore Liquid-Cooled Capacity Tracker
- 10.1Seven-Project Tracker (303 MW)
- 10.2Region × Cooling Technology Spend Matrix, 2025
- 11Regional Analysis
- 11.1West
- 11.2East
- 11.3Central
- 11.4North
- 11.5North-East
- 12Top 12 Data Center Hubs
- 12.1Tuas
- 12.2Tampines
- 12.3Jurong East and Jurong West
- 12.4Loyang
- 12.5Changi
- 12.6Kranji and Lim Chu Kang
- 12.7Genting Lane and Kallang
- 12.8one-north and Ayer Rajah
- 12.9Woodlands
- 12.10Paya Lebar
- 12.11Serangoon North
- 12.12Jurong Island
- 13Forecast Scenarios
- 13.1Low Case
- 13.2Base Case
- 13.3High Case
- 14Competitive Landscape
- 14.1Vertiv
- 14.2Schneider Electric (with Motivair)
- 14.3Daikin (Daikin Applied)
- 14.4Trane Technologies (with LiquidStack)
- 14.5Johnson Controls (Silent-Aire)
- 14.6Carrier
- 14.7STULZ
- 14.8Mitsubishi Electric
- 14.9Rittal
- 14.10Kaer
- 14.11Keppel (district and seawater cooling)
- 14.12Shell (immersion fluids)
- 14.13Delta Electronics
- 15Recent Developments
- 15.12025 Events
- 15.22026 Events
- Fig. 1Singapore Data Center Thermal Management Market Size, 2020-2035 (USD million)
- Table 1Report Attributes
- Table 2Scope Comparison
- Table 3Cooling Cost per MW, 2020-2035
- Table 4Market by Cooling Technology, 2025 and 2035
- Table 5Market by Offering, 2025 and 2035
- Table 6Market by Data Center Type, 2025 and 2035
- Table 7Singapore Liquid-Cooled Capacity Tracker
- Table 8Region × Cooling Technology Spend Matrix, 2025
- Table 9Market by Region, 2025 and 2035
- Table 10Top 12 Hubs, 2025 and 2035
- Table 11Forecast Scenarios, 2035
About this report
Written by Amit Jain and reviewed by Deepti Agrawal, Senior Editor, Research. Figures are built top-down and bottom-up and reconciled before publication, with 2025 as the base year.
Read our methodologyHow we built this
- Historical period2020-2024
- Base year2025
- Forecast period2026-2035
- Sizing approachTop-down + bottom-up
Need more than the report?
Advisory on this market
Due diligence, site selection and market entry work, by the analysts who wrote this report.
See consulting servicesFrequently asked questions
USD 313.29 million in 2026, up 20.44% from USD 260.13 million in 2025, according to DC Market Insights estimates. The market is projected to reach USD 618.39 million by 2035, a CAGR of 9.05% from 2025, as liquid-cooled capacity on Jurong Island is built.
USD 260.13 million of 2025 spend on removing heat from Singapore data halls: chiller plants, air handlers and containment, liquid cooling, district and seawater cooling, thermal controls software, design, installation and maintenance. Cooling electricity and server fans are excluded.
9.05% a year from 2025 to 2035, from USD 260.13 million to USD 618.39 million, after 14.07% a year in 2020-2025. Growth is capped by how much power Singapore releases through calls such as the 200 MW DC-CFA2.
Liquid Cooling Systems, at 23.95% a year, from USD 26.01 million in 2025 to USD 222.62 million by 2035, because DC-CFA2 capacity must reach a PUE of 1.25 at full IT load and SS 726:2026 now sets liquid cooling rules.
About USD 2.00 million per MW of IT load for a new hall in 2025, rising to USD 2.70 million by 2035, in DC Market Insights estimates. Retrofitting a live hall costs about USD 1.10 million per MW and service about USD 95,000 per MW a year.
The West, at 14.37% a year, from USD 93.65 million in 2025 to USD 358.67 million by 2035, because Tuas and the 700 MW Jurong Island data center park take most new capacity. The East leads in 2025 with 38.00%.
About 52% of 2025 spend goes to the five largest suppliers, led by Vertiv at about 14% (DC Market Insights estimate), followed by Schneider Electric, Daikin, Trane Technologies and Johnson Controls; Carrier, STULZ, Kaer and Keppel are also active.
About USD 3.5 million of 2025 spend, roughly 8% of installation and retrofit work, goes to consultants who model airflow with computational fluid dynamics, size chillers and design liquid loops to meet PUE 1.25 and SS 726:2026.
Scope: DC Market Insights counts USD 313.29 million of 2026 equipment, controls and services. Broader figures add cooling electricity (over USD 250 million a year), office comfort cooling or server fans, which are excluded here.
Five: the Green Data Centre Roadmap PUE target of 1.3, DC-CFA2’s PUE 1.25 at full load and 50% green energy, SS 697:2023 for 26°C halls, SS 726:2026 for liquid cooling, and a carbon tax of S$45 per tonne from 2026.
Air-Side Cooling and Containment, at 40.00% of 2025 spend (USD 104.05 million). Liquid Cooling Systems are smaller but rising, from 10.00% of spend in 2025 to 36.00% by 2035, because DC-CFA2 capacity must reach PUE 1.25 at full load.
USD 131.98 million, or 50.74% of 2025 spend, goes to service and retrofit of the installed base. About 1,100 MW of older halls must move toward a PUE of 1.3, which keeps this spend steady even when new completions are limited.
Get this report
How do I get the full report?
Request a quote; we reply by email within one business day.
How and when will I receive the report?
By email, within 24-48 business hours of payment.
How can I pay?
Once you accept the quote, we email you a secure payment link.
Can I see a sample first?
Yes. Request a free sample and we will email it to you.
Can the report be tailored to my needs?
Yes. We can add countries, segments or data cuts. Talk to an analyst about the scope you need.
Can I get an invoice or pay against a purchase order?
Write to sales@dcmarketinsights.com and our team will help.