
UK Data Center Storage Market Size, Share & Forecast to 2035
Market at a glance
The UK Data Center Storage market was worth USD 1,560.0 million in 2025 and is forecast to reach USD 3,780.0 million by 2035, growing at a 9.27% CAGR.
 By Amit Jain, Senior Consultant, ICT & Emerging Technologies
 Reviewed by Deepti Agrawal
Last updated 19 Oct 2026
Base year 2025 PDF + Excel
What is inside the report
- 01Introduction and Key Market Statistics
- 02Executive Summary
- 03Market Scope
- 04Market Drivers
- 05Market Trends
- 06Market Challenges
- 07Market Opportunities
- 08Pricing: Storage Spend per MW
- 09Standards and Regulation
- 10Market Segmentation
- 18chapters
- 2020-2024Historical period
- 2026-2035Forecast period
- —Companies profiled
Segmentation
Full analysis
The UK Data Center Storage Market is valued at USD 1.95 billion in 2026 and is projected to reach USD 3.78 billion by 2035, up from USD 1.56 billion in 2025, a CAGR of 9.27% from 2025 to 2035 (DC Market Insights estimate). Two things move this money in Britain: the installed IT load of UK data centres, which DC Market Insights puts at about 2,000 megawatts (MW) in 2025 against the government’s call for at least 6 gigawatts (GW) of AI-capable capacity by 2030 (Source: Department for Science, Innovation and Technology (DSIT), UK Compute Roadmap, July 2025), and the price of flash memory, which Sandisk says drove about two-thirds of its sequential revenue growth in the quarter to June 2026. DC Market Insights builds the 2025 figure as 1,760 MW of conventional IT load × USD 820,000 of storage spend per MW a year (USD 1.44 billion) plus 240 MW of AI load × USD 480,000 per MW (USD 115.20 million). UK data center storage covers the arrays, drives, storage software and support bought for UK data centres; all-flash arrays carry 43.0% of 2025 value, object storage is the fastest architecture at 13.09% a year as AI training sets and backups move to object stores, and the North of England is the fastest region at 16.66% a year because the Blyth and Cambois campus in Northumberland opens in 2028.
Key Market Statistics: How Big Is the UK Data Center Storage Market in 2026?
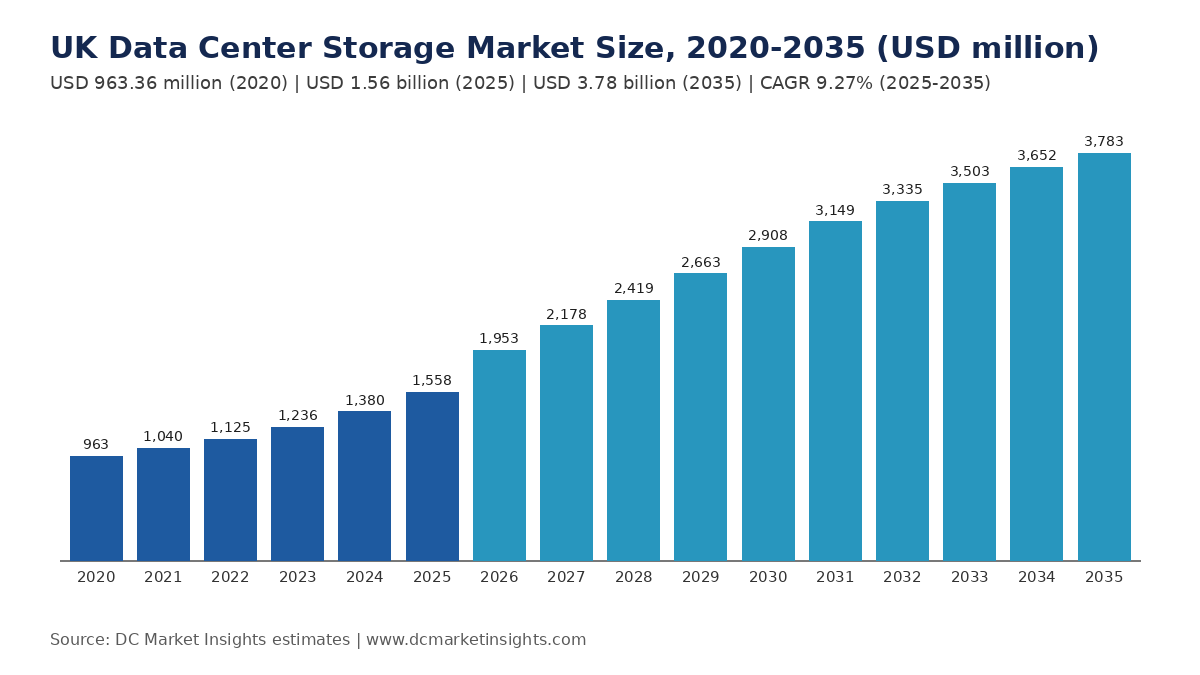
DC Market Insights values the UK Data Center Storage Market at USD 1.95 billion in 2026, 25.35% above the USD 1.56 billion of 2025. Higher flash prices and the first AI Growth Zone halls arrive in the same year.
- Market size 2025: USD 1.56 billion (DC Market Insights estimate)
- Market size 2026: USD 1.95 billion
- Market size 2030: USD 2.91 billion
- Market size 2035: USD 3.78 billion
- CAGR 2025-2035: 9.27% (low case USD 3.07 billion, high case USD 4.57 billion in 2035)
- Largest storage type: All-Flash Arrays, USD 670.11 million or 43.0% of 2025 value
- Fastest segment: Object Storage, 13.09% a year to USD 1.17 billion by 2035
- Leading region: Greater London, USD 638.95 million or 41.0% of 2025 value
- Fastest region: North of England, 16.66% a year
- Largest hub: Slough and Thames Valley, USD 264.93 million in 2025
- Market leader: Dell Technologies, about 19% of 2025 value (DC Market Insights assessment)
How Large Is the UK Data Center Storage Market and How Fast Is It Growing?
The UK Data Center Storage Market size was valued at USD 963.36 million in 2020, reached USD 1.56 billion in 2025, and is anticipated to reach USD 3.78 billion by 2035, at a CAGR of 9.27% during the forecast period.
| Attribute | Detail |
|---|---|
| Historical period | 2020-2024 |
| Base year | 2025 |
| Forecast period | 2026-2035 |
| Market size 2025 | USD 1.56 billion |
| Market size 2026 | USD 1.95 billion |
| CAGR 2025-2035 | 9.27% |
| Market size 2035 | USD 3.78 billion |
| Unit | USD million, nominal |
UK data center storage spend grew 10.10% a year from 2020 to 2025 as installed IT load rose from about 1,350 MW to 2,000 MW, and the 2025-2035 rate of 9.27% reflects load rising to 6,500 MW while storage spend per AI megawatt stays at about 55-60% of the conventional level. DC Market Insights estimates that AI halls hold 7.4% of storage value in 2025 and 46.4% by 2035.
What Does UK Data Center Storage Include and Exclude?
The UK Data Center Storage Market covers USD 1.56 billion of 2025 spend on storage systems, drives, software and support in UK data centres. Values are the price paid by the operator or tenant.
Included
- All-flash, hybrid and hard disk drive (HDD) arrays and mass-capacity systems in hyperscale, colocation, enterprise and public-sector data centres
- Software-defined storage, object storage platforms and storage operating-system subscriptions
- Server-based storage: solid-state drives (SSDs) and HDDs bought for storage nodes in cloud data centres
- Vendor support contracts and storage-as-a-service fees for on-premises capacity
Excluded
- Cloud storage service revenue sold to end customers (it is the return on this spend, not extra spend)
- Boot drives inside compute servers, PCs and edge devices outside data centres
- Backup software sold as a separate licence and tape media
- The rest of data centre spend (servers, network, power, cooling and buildings), which sits in the UK Data Center Market report; the UK storage layer equals about 12.9% of that report’s USD 12.11 billion 2025 value
How the segments fit together
Every dimension sums to the same total: storage type, architecture and buyer each add up to USD 1.56 billion in 2025 and USD 3.78 billion in 2035, and the five UK regions add up to the national figure in both years.
Why Do UK Data Center Storage Market Estimates Differ?
DC Market Insights puts UK data center storage at USD 1.95 billion in 2026, and wider estimates run more than two times higher because they add cloud storage services. DC Market Insights counts only the hardware, software and support bought for UK sites.
Broader definitions add cloud storage subscriptions paid by UK companies to providers that may serve them from Ireland or the Netherlands, backup and archive software, tape libraries and the storage inside every server. Each is a real flow of money, but adding cloud storage revenue to the drives that deliver it counts the same petabyte twice, and an earlier edition of this page used that wider frame. In-scope buyers include hyperscale cloud operators, colocation tenants such as banks and insurers in Docklands, enterprise IT departments, universities and research councils, NHS trusts, government departments, and small and medium-sized enterprises (SMEs) that rent racks in regional colocation sites.
| Element | In DC Market Insights scope | Why |
|---|---|---|
| Storage arrays, drives and software in UK data centres | Yes, USD 1.56 billion (2025) | Capital and support spend at UK sites |
| Cloud storage service revenue | No | Return on the same hardware |
| Boot drives in compute servers | No | Counted with servers |
| Tape media and stand-alone backup licences | No | Separate data-protection markets |
What Is Driving UK Data Center Storage Demand?
Three UK-specific forces add about USD 1.35 billion of annual storage spend between 2025 and 2030: AI Growth Zone campuses, critical national infrastructure duties that force replicated copies, and the 2026 flash price reset.
AI Growth Zones: Culham, Blyth and North Wales Add Gigawatts
The government named Culham in Oxfordshire as the first AI Growth Zone in January 2025, then confirmed a North East zone in September 2025 where Blackstone committed £10 billion to the QTS campus at Blyth and Cambois, due to open in 2028 with energy capacity rising to 1.1 GW, and a North Wales zone in November 2025 that could add up to 4 GW (Source: DSIT and Prime Minister’s Office releases). The UK Compute Roadmap forecasts that the UK will need at least 6 GW of AI-capable data centre capacity by 2030 (Source: DSIT). DC Market Insights does not assume that target is met and models 4,200 MW of installed IT load in 2030, of which 45% is AI, which lifts the AI share of storage value from 7.4% to 32.5%.
Critical National Infrastructure Status: Two Copies of Every Critical Dataset
Data centres were designated Critical National Infrastructure on 12 September 2024, the first new designation in almost a decade, and the government put UK data-centre industry revenue at about £4.6 billion a year (Source: DSIT). The Cyber Security and Resilience Bill factsheet brings third-party data centres of 1 MW of rated IT load and above, and enterprise sites of 10 MW and above, under Ofcom as regulator (Source: DSIT, updated June 2026). DC Market Insights estimates that replication and immutable snapshot capacity for regulated tenants adds about 8% to storage spend per conventional MW, worth about USD 115 million in 2025.
Flash Price Reset: Storage Spend per MW Up 12.2% in 2026
Sandisk reported fiscal 2026 revenue of USD 20.25 billion, up 175%, with data center revenue of USD 5.15 billion, up 437%, and said about two-thirds of fourth-quarter sequential growth came from higher pricing (Source: Sandisk fiscal fourth quarter 2026 results). UK buyers pay the same component prices, so DC Market Insights raises storage spend per conventional MW from USD 820,000 in 2025 to USD 920,000 in 2026, which explains about USD 187 million of the USD 395.04 million jump in 2026.
Which Trends Are Changing How UK Data Centres Buy Storage?
Object storage rises from 22.0% to 31.0% of UK data centre storage value by 2035, while block storage falls from 35.0% to 25.0%. Buyers are also moving from owned arrays to subscriptions.
Object Stores Feed AI Training in Northern Campuses
AI clusters such as the Microsoft and Nscale supercomputer of more than 23,000 NVIDIA graphics processing units (GPUs) and the OpenAI Stargate UK offtake of up to 8,000 GPUs in the first quarter of 2026, scaling to 31,000, read training data from object and parallel file stores (Source: Microsoft, September 2025; OpenAI, September 2025). Object storage grows 13.09% a year and reaches 31.0% of UK storage value by 2035 (DC Market Insights estimate).
Subscription Arrays Replace Five-Year Purchases
Pure Storage reported fiscal 2026 revenue of USD 3.66 billion, up 16%, with subscription annual recurring revenue (ARR) of USD 1.9 billion (Source: Pure Storage fiscal 2026 results, SEC filing); NetApp reported fiscal 2026 revenue of USD 6.93 billion and fourth-quarter all-flash array revenue of USD 1.2 billion, up 18% (Source: NetApp). In the UK model, subscription and support fees make up about 22% of 2025 storage spend, rising to about 30% by 2035 (DC Market Insights estimate).
Mass-Capacity HDDs Stay in Cloud Tiers
Seagate reported fiscal 2026 revenue of USD 12.2 billion, driven by cloud data-centre demand and its heat-assisted magnetic recording (HAMR) Mozaic platform (Source: Seagate); HDD and mass-capacity systems keep about 22% of UK value in 2035, USD 832.26 million, because cold data still costs less per terabyte on disk than on flash.
What Holds Back UK Data Center Storage Growth?
Grid access and flash prices hold the UK Data Center Storage Market to 4,200 MW of IT load in 2030 in the DC Market Insights base case. Reaching 6 GW instead would add about USD 0.8 billion of 2035 storage value.
Grid Connection Queues: 80 GW of Data Centre Requests
Ofgem reported on 29 July 2026 that demand connection applications in Great Britain rose from 41 GW to 125 GW in under a year, with data centres accounting for at least 80 GW (Source: Ofgem). Most of those projects will not be built on their requested dates, and storage spend follows energised megawatts, not applications, so DC Market Insights adds 300-550 MW a year after 2027, not the queue volume.
Flash Price Volatility and Budget Deferrals
A 12.2% rise in storage spend per MW in 2026 squeezes enterprise IT budgets that are set in pounds; DC Market Insights models enterprise on-premises storage growing only 4.55% a year to USD 680.94 million by 2035, as some buyers stretch arrays to seven years or move cold data to cloud tiers.
Where Are the Biggest Opportunities in UK Data Center Storage?
AI halls are the largest opening in UK data center storage, rising to 32.5% of value by 2030. The North of England build-out is the second, with its share rising from 13.0% to 25.0% by 2035.
AI Data Pipelines: 1,890 MW of AI Load by 2030
With 1,890 MW of AI load in 2030 in the model, suppliers of high-throughput file systems, object stores and dense SSD shelves capture most of the growth; AI halls take 7.4% of storage value in 2025 and 32.5% in 2030 (DC Market Insights estimate).
Northern Campuses: 16.66% a Year
The North of England rises from 13.0% to 25.0% of UK storage value as Blyth and Cambois, Teesside and Manchester add load; DC Market Insights models 16.66% a year for the region and USD 397.21 million for the Blyth and Cambois hub alone by 2035.
How Much Do UK Data Centres Spend on Storage per MW?
UK data centres spend about USD 820,000 a year on storage per MW of conventional IT load in 2025 (DC Market Insights estimate). An AI megawatt carries USD 480,000, and both rise in 2026, to USD 920,000 and USD 540,000, as flash prices reset.
| Storage spend (USD thousand per installed MW per year) | 2020 | 2025 | 2030 | 2035 |
|---|---|---|---|---|
| Conventional IT load | 720 | 820 | 850 | 780 |
| AI IT load | 400 | 480 | 500 | 450 |
| Installed IT load (MW) | 1,350 | 2,000 | 4,200 | 6,500 |
The conventional figure is about 7% of the USD 11.30 million facility cost per MW that DC Market Insights uses for UK builds, and it falls after 2030 because cost per terabyte keeps falling while capacity per rack rises. Public price anchors come from vendor filings rather than list prices: Pure Storage guided fiscal 2027 revenue to USD 4.3-4.4 billion, and Dell reported fiscal 2026 storage revenue of about USD 16.6 billion, up 1%, while its AI server backlog reached USD 43 billion (Source: Pure Storage; Dell Technologies).
Which Rules and Standards Govern Data Center Storage in the UK?
Five rule sets shape UK data centre storage purchases, from the 1 MW threshold of the Cyber Security and Resilience Bill to the storage-limitation principle of UK data protection law (Source: DSIT, ICO, NCSC, ISO).
- Critical National Infrastructure designation, 12 September 2024: data centres join the CNI regime, with government support during incidents (Source: DSIT)
- Cyber Security and Resilience Bill: third-party data centres from 1 MW rated IT load and enterprise sites from 10 MW in scope, Ofcom as regulator (Source: DSIT factsheet, updated June 2026)
- Data (Use and Access) Act 2025: Royal Assent on 19 June 2025, data protection changes phased in over 2 to 12 months (Source: DSIT guidance)
- UK GDPR Article 5(1)(e) storage limitation: personal data kept only as long as necessary, which drives retention and deletion features (Source: Information Commissioner’s Office (ICO))
- National Cyber Security Centre (NCSC) Cloud Security Principles (14 principles) and ISO/IEC 27040:2024 storage security, used in public-sector tenders (Source: NCSC; ISO)
Which Storage Type Leads the UK Data Center Storage Market?
All-flash arrays lead UK data center storage with USD 670.11 million, or 43.0% of 2025 value, and object storage is the fastest-growing segment at 13.09% a year.
By Storage Type
All-flash arrays grow 11.37% a year to USD 1.97 billion by 2035, while hybrid flash arrays grow only 1.34% a year as buyers skip them.
| Storage Type | 2025 (USD million) | Share 2025 | 2035 (USD million) | CAGR 2025-2035 |
|---|---|---|---|---|
| All-Flash Arrays | 670.11 | 43.0% | 1,967.16 | 11.37% |
| Hybrid Flash Arrays | 264.93 | 17.0% | 302.64 | 1.34% |
| HDD and Mass-Capacity Systems | 374.02 | 24.0% | 832.26 | 8.33% |
| Software-Defined Storage | 249.34 | 16.0% | 680.94 | 10.57% |
| Total | 1,558.40 | 100.0% | 3,783.00 | 9.27% |
By Architecture
Object storage rises from USD 342.85 million to USD 1.17 billion by 2035 and overtakes block storage area network (SAN) storage before 2035.
| Architecture | 2025 (USD million) | Share 2025 | 2035 (USD million) | CAGR 2025-2035 |
|---|---|---|---|---|
| Block Storage (SAN) | 545.44 | 35.0% | 945.75 | 5.66% |
| File Storage (NAS) | 420.77 | 27.0% | 1,021.41 | 9.27% |
| Object Storage | 342.85 | 22.0% | 1,172.73 | 13.09% |
| Server-Based and Direct-Attached | 249.34 | 16.0% | 643.11 | 9.94% |
| Total | 1,558.40 | 100.0% | 3,783.00 | 9.27% |
By Buyer
Hyperscale cloud operators buy 37.0% of UK storage value in 2025 and 49.0% by 2035, growing 12.39% a year.
| Buyer | 2025 (USD million) | Share 2025 | 2035 (USD million) | CAGR 2025-2035 |
|---|---|---|---|---|
| Hyperscale Cloud | 576.61 | 37.0% | 1,853.67 | 12.39% |
| Colocation Tenants | 420.77 | 27.0% | 945.75 | 8.44% |
| Enterprise On-Premises | 436.35 | 28.0% | 680.94 | 4.55% |
| Public Sector and Research | 124.67 | 8.0% | 302.64 | 9.27% |
| Total | 1,558.40 | 100.0% | 3,783.00 | 9.27% |
DC Exclusive: The UK AI Growth Zone Storage Pipeline Tracker (7 Named Projects, 1.4 GW)
Seven named UK projects with about 1.4 GW of disclosed capacity will need roughly USD 750 million a year of storage once fully live, DC Market Insights estimates. The tracker is a DC Market Insights model built from 14 inputs (government releases, company announcements, GPU counts converted at about 1.8 kilowatts per GPU, and the per-MW storage values in the pricing table).
| Project | Location | Disclosed size | Timing | Modelled storage spend when live (USD million a year) |
|---|---|---|---|---|
| QTS (Blackstone), Blyth and Cambois | North East AI Growth Zone | £10 billion; up to 1,100 MW | 2028 opening | About 500 |
| Equinix, Hertfordshire campus | 85 acres | £3.9 billion; 250+ MW | Announced 30 October 2025 | About 205 |
| Google, Waltham Cross | Hertfordshire | Part of £5 billion over two years | Opened September 2025 | Not disclosed |
| Microsoft and Nscale supercomputer | UK | 23,000+ GPUs within USD 30 billion programme | 2025-2028 | About 20 |
| OpenAI Stargate UK (Nscale, NVIDIA) | Cobalt Park and other sites | 8,000 GPUs, scaling to 31,000 | From Q1 2026 | About 7 to 27 |
| Culham AI Growth Zone | Oxfordshire | First AI Growth Zone | Named January 2025 | Model: USD 151.32 million hub value by 2035 |
| North Wales AI Growth Zone | Anglesey and Trawsfynydd | Up to 4 GW potential | Confirmed 13 November 2025 | Model: USD 113.49 million hub value by 2035 |
The Blyth and Cambois campus alone would add about a third of the UK’s 2025 storage spend once its 1.1 GW is in use, which is why the North of England is the fastest region in the model. The tracker also shows the gap between announcements and energised load: Ofgem’s 80 GW of data centre connection requests is 40 times the 2,000 MW installed in 2025.
Which UK Region Leads Data Center Storage Spending and Which Grows Fastest?
Greater London leads with USD 638.95 million in 2025, and the North of England is the fastest-growing region at 16.66% a year to USD 945.75 million by 2035.
| Region | 2025 (USD million) | Share 2025 | 2035 (USD million) | CAGR 2025-2035 |
|---|---|---|---|---|
| Greater London | 638.95 | 41.0% | 1,021.41 | 4.80% |
| South East and East of England | 467.52 | 30.0% | 1,134.90 | 9.27% |
| North of England | 202.59 | 13.0% | 945.75 | 16.66% |
| Wales and the West | 124.67 | 8.0% | 378.30 | 11.74% |
| Scotland Midlands and Northern Ireland | 124.67 | 8.0% | 302.64 | 9.27% |
| United Kingdom | 1,558.40 | 100.0% | 3,783.00 | 9.27% |
Greater London
Docklands, West London and the City hold 41.0% of 2025 storage value because banks, insurers and exchanges keep latency-sensitive data close; growth slows to 4.80% a year as new load moves out of the capital’s constrained grid.
South East and East of England
Slough, the Thames Valley, Hertfordshire and Culham hold USD 467.52 million in 2025 and grow 9.27% a year, helped by the £3.9 billion Equinix campus and Google’s Waltham Cross site (Source: Equinix; Google).
North of England
Manchester, Teesside and the Blyth and Cambois zone rise from USD 202.59 million to USD 945.75 million, the fastest rate at 16.66% a year, because the North East zone targets £30 billion of private investment (Source: DSIT, September 2025).
Wales and the West
Newport and the North Wales AI Growth Zone grow 11.74% a year to USD 378.30 million by 2035.
Scotland, Midlands and Northern Ireland
Central Scotland, the Midlands and Belfast share USD 124.67 million in 2025, growing 9.27% a year, with university and public research storage a large share.
Which UK Data Centre Hubs Buy the Most Storage?
Slough and the Thames Valley is the largest UK data centre storage hub at USD 264.93 million in 2025, and Hertfordshire is the fastest large hub at 11.28% a year.
| Rank | Hub | Region | 2025 (USD million) | 2035 (USD million) | CAGR |
|---|---|---|---|---|---|
| 1 | Slough and Thames Valley | South East and East of England | 264.93 | 491.79 | 6.38% |
| 2 | London Docklands | Greater London | 249.34 | 359.38 | 3.72% |
| 3 | West London and Park Royal | Greater London | 202.59 | 321.56 | 4.73% |
| 4 | Central London | Greater London | 187.01 | 340.47 | 6.17% |
| 5 | Manchester | North of England | 127.79 | 283.73 | 8.30% |
| 6 | Hertfordshire (Waltham Cross and Hemel) | South East and East of England | 116.88 | 340.47 | 11.28% |
| 7 | Newport and South Wales | Wales and the West | 77.92 | 189.15 | 9.27% |
| 8 | Central Scotland | Scotland Midlands and Northern Ireland | 62.34 | 132.41 | 7.82% |
| 9 | Teesside | North of England | 23.38 | 151.32 | 20.53% |
| 10 | Oxfordshire (Culham) | South East and East of England | 15.58 | 151.32 | 25.53% |
| 11 | North Wales | Wales and the West | 7.79 | 113.49 | 30.72% |
| 12 | Blyth and Cambois (Northumberland) | North of England | 4.68 | 397.21 | 55.91% |
The 12 hubs carry 86.0% of 2025 spend; Blyth and Cambois grows fastest from a small base (55.91% a year to USD 397.21 million) because almost all of its capacity comes after 2028.
How Could the UK Data Center Storage Forecast for 2035 Change?
The 2035 value ranges from USD 3.07 billion if grid queues hold installed load near 5,400 MW to USD 4.57 billion if load reaches 7,600 MW, around a base case of USD 3.78 billion.
| Scenario | 2035 (USD million) | Assumption |
|---|---|---|
| Low | 3,070.30 | 5,400 MW installed in 2035, AI share 55%, storage spend per MW 5% lower |
| Base | 3,783.00 | 6,500 MW installed in 2035, AI share 60% |
| High | 4,565.36 | 7,600 MW installed in 2035 (roadmap pace kept), AI share 63%, spend per MW 5% higher |
Who Are the Leading Companies in the UK Data Center Storage Market?
Dell Technologies leads UK data center storage with about 19% of 2025 value, and the top five array vendors hold about 48% (DC Market Insights assessment). The five are Dell, NetApp, Hewlett Packard Enterprise (HPE), Pure Storage and IBM, ranked on reported storage revenue and UK installed bases; hyperscalers buy most of the rest as drives direct from manufacturers.
- Dell Technologies
- NetApp
- Hewlett Packard Enterprise (HPE)
- Pure Storage
- IBM
- Hitachi Vantara
- Huawei
- Lenovo
- Cisco Systems
- Nutanix
- VAST Data
- DataDirect Networks (DDN)
- Seagate Technology
- Western Digital
- Sandisk
- Micron Technology
- Samsung Electronics
Dell reported fiscal 2026 storage revenue of about USD 16.6 billion and NetApp USD 6.93 billion of total revenue, according to the companies; Pure Storage announced a design win with a top-four hyperscaler for its DirectFlash technology in December 2024 (Source: Pure Storage), and Micron reported fiscal 2026 revenue of USD 133.19 billion with data-centre SSDs ramping (Source: Micron).
What Has Happened Recently in the UK Data Center Storage Market?
Six dated events since 2024 put more than £30 billion of named UK data centre spending and a new grid regime behind storage demand.
- In July 2026, Ofgem reported at least 80 GW of data centre demand in the Great Britain connection queue and moved to free grid capacity from speculative projects (Source: Ofgem).
- In November 2025, the government confirmed the North Wales AI Growth Zone with up to 4 GW of potential capacity (Source: DSIT).
- In October 2025, Equinix announced a £3.9 billion, 250+ MW campus in Hertfordshire (Source: Equinix).
- In September 2025, Blackstone committed £10 billion to the Blyth and Cambois campus in the North East AI Growth Zone (Source: DSIT).
- In September 2025, Microsoft committed USD 30 billion to the UK for 2025-2028, including a supercomputer of more than 23,000 GPUs with Nscale (Source: Microsoft).
- In September 2024, data centres were designated Critical National Infrastructure (Source: DSIT).
What Should Storage Vendors and Investors Take Away from the UK Data Center Storage Market?
DC Market Insights draws four conclusions from the USD 1.56 billion 2025 base.
- Energised megawatts set the pace: the base case adds 2,200 MW by 2030, well short of the 6 GW roadmap, because grid connections lag announcements.
- Flash pricing drives 2026: storage spend per conventional MW rises 12.2% in 2026, adding about USD 187 million to the year.
- Growth moves north: the North of England grows 16.66% a year as Blyth and Cambois opens in 2028.
- Object storage is the format to watch: it grows 13.09% a year and passes block storage before 2035.
How the Model Was Built: Methodology for the UK Data Center Storage Market
DC Market Insights built the model bottom-up from 16 yearly capacity points (2020-2035), 2 storage intensities and 2,000 MW of 2025 IT load, giving USD 1.56 billion for 2025.
- Capacity: installed UK IT load 1,350 MW in 2020, 2,000 MW in 2025, 4,200 MW in 2030 and 6,500 MW in 2035 (DC Market Insights estimates, checked against the roadmap’s 6 GW need for 2030); AI share of installed load 2% in 2020, 12% in 2025, 45% in 2030 and 60% in 2035.
- Unit values: storage spend per conventional MW USD 720,000 (2020), USD 820,000 (2025), USD 920,000 (2026), USD 850,000 (2030), USD 780,000 (2035); per AI MW USD 400,000, USD 480,000, USD 540,000, USD 500,000 and USD 450,000.
- Check 1 (ceiling): the 2025 value of USD 1.56 billion equals 12.9% of the USD 12.11 billion UK data centre total, inside a 10-15% storage share of data centre spend.
- Check 2 (ceiling): USD 1.56 billion equals 3.5% of the USD 44.54 billion combined fiscal 2026 revenue of Dell storage, NetApp, Pure Storage, Seagate and Sandisk data center, below a 4% UK share of global storage supply.
- Check 3 (floor): 1,760 conventional MW × a minimum USD 400,000 per MW a year (a five-year refresh of USD 2 million of storage per MW) gives USD 0.70 billion, below the USD 1.44 billion conventional line.
The full approach is on the research methodology page; flash supply is analysed in the NAND Flash and Enterprise SSD Market report, block storage networks in the Server Storage Area Network Market report, and the largest comparable country market in the U.S. Data Center Storage Market report.
Table of contents
- 01Introduction and Key Market Statistics
- 1.1Market Snapshot, 2025, 2026 and 2035
- 1.2Key Market Statistics
- 02Executive Summary
- 2.1Market Size 2020-2035
- 2.2AI Share of Storage Value
- 03Market Scope
- 3.1Included
- 3.2Excluded
- 3.3How the Segments Fit Together
- 3.4Why UK Data Center Storage Market Estimates Differ
- 04Market Drivers
- 4.1AI Growth Zones: Culham, Blyth and North Wales
- 4.2Critical National Infrastructure Status
- 4.3Flash Price Reset in 2026
- 05Market Trends
- 5.1Object Stores Feed AI Training
- 5.2Subscription Arrays Replace Five-Year Purchases
- 5.3Mass-Capacity HDDs Stay in Cloud Tiers
- 06Market Challenges
- 6.1Grid Connection Queues
- 6.2Flash Price Volatility and Budget Deferrals
- 07Market Opportunities
- 7.1AI Data Pipelines
- 7.2Northern Campuses
- 08Pricing: Storage Spend per MW
- 8.1Conventional and AI Storage Spend per MW, 2020-2035
- 09Standards and Regulation
- 9.1Critical National Infrastructure Designation
- 9.2Cyber Security and Resilience Bill
- 9.3Data (Use and Access) Act 2025
- 9.4UK GDPR Storage Limitation
- 9.5NCSC Cloud Security Principles and ISO/IEC 27040:2024
- 10Market Segmentation
- 10.1By Storage Type: All-Flash Arrays, Hybrid Flash Arrays, HDD and Mass-Capacity Systems, Software-Defined Storage
- 10.2By Architecture: Block Storage (SAN), File Storage (NAS), Object Storage, Server-Based and Direct-Attached
- 10.3By Buyer: Hyperscale Cloud, Colocation Tenants, Enterprise On-Premises, Public Sector and Research
- 11DC Exclusive: UK AI Growth Zone Storage Pipeline Tracker
- 11.1Seven Named Projects and Modelled Storage Spend
- 12Regional Insights
- 12.1Greater London
- 12.2South East and East of England
- 12.3North of England
- 12.4Wales and the West
- 12.5Scotland Midlands and Northern Ireland
- 13Hub Analysis
- 13.1Slough and Thames Valley
- 13.2London Docklands
- 13.3West London and Park Royal
- 13.4Central London
- 13.5Manchester
- 13.6Hertfordshire (Waltham Cross and Hemel)
- 13.7Newport and South Wales
- 13.8Central Scotland
- 13.9Teesside
- 13.10Oxfordshire (Culham)
- 13.11North Wales
- 13.12Blyth and Cambois (Northumberland)
- 14Forecast Scenarios
- 14.1Low Case
- 14.2Base Case
- 14.3High Case
- 15Competitive Insights
- 15.1Dell Technologies
- 15.2NetApp
- 15.3Hewlett Packard Enterprise (HPE)
- 15.4Pure Storage
- 15.5IBM
- 15.6Hitachi Vantara
- 15.7Huawei
- 15.8Lenovo
- 15.9Cisco Systems
- 15.10Nutanix
- 15.11VAST Data
- 15.12DataDirect Networks (DDN)
- 15.13Seagate Technology
- 15.14Western Digital
- 15.15Sandisk
- 15.16Micron Technology
- 15.17Samsung Electronics
- 15.18Market Concentration
- 16Recent Developments
- 16.1Dated Events 2024-2026
- 17Analyst Takeaways
- 17.1Four Conclusions
- 18Methodology
- 18.1Capacity and Unit Values
- 18.2Bound Checks
- Fig. 1UK Data Center Storage Market Size, 2020-2035 (USD million)
- Table 1Market Snapshot
- Table 2Scope Comparison
- Table 3Storage Spend per MW, 2020-2035
- Table 4By Storage Type
- Table 5By Architecture
- Table 6By Buyer
- Table 7UK AI Growth Zone Storage Pipeline Tracker
- Table 8Regional Market Size
- Table 9Top 12 Hubs
- Table 10Forecast Scenarios 2035
About this report
Written by Amit Jain and reviewed by Deepti Agrawal, Senior Editor, Research. Figures are built top-down and bottom-up and reconciled before publication, with 2025 as the base year.
Read our methodologyHow we built this
- Historical period2020-2024
- Base year2025
- Forecast period2026-2035
- Sizing approachTop-down + bottom-up
Need more than the report?
Advisory on this market
Due diligence, site selection and market entry work, by the analysts who wrote this report.
See consulting servicesFrequently asked questions
USD 1.95 billion in 2026, up 25.35% from USD 1.56 billion in 2025, according to DC Market Insights estimates. The market is projected to reach USD 3.78 billion by 2035, a CAGR of 9.27% from 2025, as installed UK IT load rises from 2,000 MW to 6,500 MW.
9.27% a year from 2025 to 2035, after 10.10% a year from 2020 to 2025. Growth follows energised megawatts: DC Market Insights models 4,200 MW of UK IT load in 2030, short of the 6 GW the UK Compute Roadmap asks for.
About USD 820,000 a year per MW of conventional IT load and USD 480,000 per MW of AI load in 2025, rising to USD 920,000 and USD 540,000 in 2026 as flash prices reset (DC Market Insights estimates).
All-flash arrays, with USD 670.11 million or 43.0% of 2025 value, growing 11.37% a year to USD 1.97 billion by 2035. Object storage is the fastest architecture at 13.09% a year.
Greater London, with USD 638.95 million or 41.0% of 2025 value. The North of England grows fastest at 16.66% a year to USD 945.75 million by 2035 as the Blyth and Cambois campus opens in 2028.
Dell Technologies leads with about 19% of 2025 value (DC Market Insights assessment), and the top five array vendors (Dell, NetApp, HPE, Pure Storage and IBM) hold about 48%. Hyperscalers buy most of the rest as drives from Seagate, Western Digital, Sandisk, Micron and Samsung.
Seven named UK projects with about 1.4 GW of disclosed capacity would need roughly USD 750 million a year of storage once fully live (DC Market Insights tracker). Blyth and Cambois alone, at up to 1.1 GW, would add about a third of 2025 UK storage spend.
Spend rises USD 395.04 million in 2026, and about USD 187 million of that comes from higher flash prices: Sandisk said about two-thirds of its June 2026 quarter sequential growth came from pricing. The rest comes from 300 MW of new load.
Data centres became Critical National Infrastructure on 12 September 2024, and the Cyber Security and Resilience Bill covers third-party sites from 1 MW of rated IT load. UK GDPR storage limitation, the Data (Use and Access) Act 2025 and ISO/IEC 27040:2024 also shape purchases.
USD 1.95 billion in 2026 is the DC Market Insights figure for storage hardware, software and support bought for UK sites. Estimates that add cloud storage service revenue, server boot drives, tape or stand-alone backup software come out more than two times higher.
Get this report
How do I get the full report?
Request a quote; we reply by email within one business day.
How and when will I receive the report?
By email, within 24–48 business hours of payment.
How can I pay?
Once you accept the quote, we email you a secure payment link.
Can I see a sample first?
Yes. Request a free sample and we will email it to you.
Can the report be tailored to my needs?
Yes. We can add countries, segments or data cuts. Talk to an analyst about the scope you need.
Can I get an invoice or pay against a purchase order?
Write to sales@dcmarketinsights.com and our team will help.