
Poland Data Center Storage Market Size, Share & Forecast to 2035
Market at a glance
The Poland Data Center Storage market was worth USD 116.7 million in 2025 and is forecast to reach USD 297.0 million by 2035, growing at a 9.79% CAGR.
 By Amit Jain, Senior Consultant, ICT & Emerging Technologies
 Reviewed by Deepti Agrawal
Last updated 20 Nov 2026
Base year 2025 PDF + Excel
Key findings
Microsoft's PLN 2.8 Billion Poland Central Expansion
Object Storage for AI Datasets at 130 kW Racks in Poznań
Falling Storage Spend per Megawatt
The 150 MW Poznań Campus
What is inside the report
- 01Key Market Statistics: Poland's USD 132.91 million Storage Year in Ten Figures
- 02Key Takeaways: What the Warsaw and Poznań Build-Out Means for Storage Buyers
- 03Executive Summary: How Has Polish Data Center Storage Spend Moved Since 2020?
- 04Which Storage Systems Inside Polish Data Halls Does the Market Count?
- 05Why Is This Estimate Five Times Smaller Than the Earlier Edition?
- 06Market Drivers: Which Polish Projects Are Pulling Storage Demand Forward?
- 07Market Trends: How Are Polish Buyers Changing the Storage They Buy?
- 08Market Challenges: What Holds Back Polish Storage Spending?
- 09Market Opportunities: Where Can Storage Suppliers Win New Polish Contracts?
- 10What Does Storage Cost per Megawatt in a Polish Data Center?
- 19chapters
- 2020-2024Historical period
- 2026-2035Forecast period
- —Companies profiled
Segmentation
Recent developments
Beyond.pl raised the target capacity of its Poznań campus from 86 MW to 150 MW and prepared new space for 130+ kW racks (Source: Beyond.pl).
the Digital Operational Resilience Act began to apply to Polish banks and insurers on 17 January (Source: EUR-Lex).
Microsoft announced PLN 2.8 billion for cloud and AI infrastructure in Poland by June 2026 (Source: Microsoft).
Atman opened the first 14.4 MW building of its 43 MW WAW-3 campus near Warsaw (Source: Atman).
the President of Poland signed the amended Act on the National Cybersecurity System on 19 February (Source: Act on the National Cybersecurity System).
Full analysis
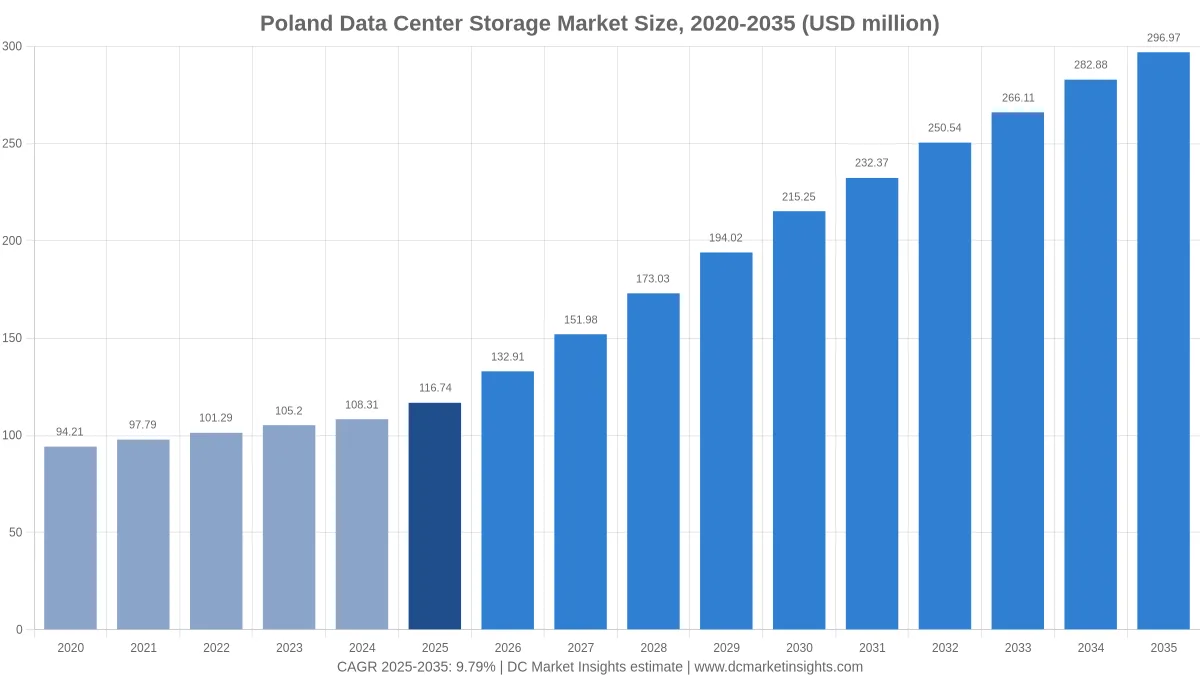
The Poland Data Center Storage Market is valued at USD 132.91 million in 2026 and is projected to reach USD 296.97 million by 2035, up from USD 116.74 million in 2025, a CAGR of 9.79% from 2025 to 2035 (DC Market Insights estimate). Poland Data Center Storage covers the disk, flash, object and tape systems, the storage software and the storage support contracts installed in data halls on Polish soil, from Warsaw colocation floors to the Poznań and Kraków campuses. What moves the money in Poland is the arrival of three large campus programmes in under two years: Data4 offers up to 60 MW of IT power at Jawczyce, Atman’s Warsaw-3 (WAW-3) campus near Ożarów Mazowiecki is planned for 43 MW with a PLN 2.5 billion budget, and Beyond.pl raised its Poznań target from 86 MW to 150 MW (Source: Data4, Atman, Beyond.pl). Every megawatt that fills with tenants brings about USD 0.34 million of storage spend a year, so the 2025 build receipt is 325 MW of average installed IT capacity × USD 0.343 million per MW-year = USD 111.73 million, plus 4.56 MW of new AI capacity × USD 1.10 million = USD 5.01 million. Object Storage grows fastest at 18.48% a year, and Greater Poland is the fastest region at 14.95% because the Poznań campus is built for racks above 130 kW.
Key Market Statistics: Poland’s USD 132.91 million Storage Year in Ten Figures
Polish data centers will spend USD 132.91 million on storage systems, storage software and storage support in 2026, 13.85% more than in 2025, DC Market Insights estimates.
- Market size 2025: USD 116.74 million
- Market size 2026: USD 132.91 million
- Market size 2030: USD 215.25 million
- Market size 2035: USD 296.97 million
- CAGR 2025-2035: 9.79% (low case 7.36%, high case 11.71%)
- Largest storage type: All-Flash Arrays, 44% of 2025 value
- Fastest architecture: Object Storage, 18.48% CAGR
- Leading region: Warsaw Metropolitan Area, 61% of 2025 value; fastest region: Greater Poland, 14.95% CAGR
- Largest city: Warsaw, USD 39.69 million in 2025
- Market leaders: Dell Technologies, Hewlett Packard Enterprise (HPE) and NetApp, about 41% of external array spend together (DC Market Insights estimate)
Key Takeaways: What the Warsaw and Poznań Build-Out Means for Storage Buyers
- All-flash arrays rise from 44% to 62% of value by 2035 because banks under the Digital Operational Resilience Act (DORA) replace hybrid arrays with flash that restores faster.
- Cloud and Colocation Providers grow 12.92% a year because Microsoft’s PLN 2.8 billion programme and the new colocation campuses move storage out of corporate server rooms.
- The Warsaw Metropolitan Area slips from 61% to 52% of value because Poznań adds 64 MW of planned campus capacity on top of its first 86 MW target.
- Storage spend per megawatt falls 3% a year, from USD 0.343 million in 2025 to USD 0.253 million in 2035, because each rack holds more compute per terabyte stored.
Executive Summary: How Has Polish Data Center Storage Spend Moved Since 2020?
The Poland Data Center Storage Market size was valued at USD 94.21 million in 2020, reached USD 116.74 million in 2025, and is anticipated to reach USD 296.97 million by 2035, at a CAGR of 9.79% during the forecast period. From 2020 to 2025 the market grew only 4.38% a year: installed IT capacity rose from about 243 MW to 342 MW, but falling flash prices per terabyte cut the spend each megawatt carries.
| Attribute | Detail |
|---|---|
| Historical period | 2020-2024 |
| Base year | 2025 |
| Forecast period | 2026-2035 |
| Market size 2025 | USD 116.74 million |
| Market size 2026 | USD 132.91 million |
| CAGR 2025-2035 | 9.79% |
| Market size 2035 | USD 296.97 million |
Growth speeds up after 2025 because new IT capacity jumps from about 20 MW a year in 2020-2024 to 38 MW in 2025 and 85 MW in 2030 as the Jawczyce, Duchnice and Poznań campuses fill. DC Market Insights values installed-base storage at USD 111.73 million in 2025 and AI cluster storage at USD 5.01 million; by 2035 the AI line reaches USD 38.42 million as 45% of new capacity is built for AI.
Which Storage Systems Inside Polish Data Halls Does the Market Count?
The Poland Data Center Storage Market counts USD 116.74 million of storage equipment, storage software and storage support bought in 2025 for data halls in Poland run by cloud providers, colocation firms, telecom operators, banks, public bodies and other enterprises.
Included: all-flash and hybrid flash arrays, HDD-based and distributed systems, tape and archive libraries, Storage Area Network (SAN) and Network-Attached Storage (NAS) systems, scale-out file and object platforms, hyperconverged storage nodes, storage software for replication, snapshots and backup, and storage support and managed storage contracts.
Excluded: servers and graphics processing units (GPUs), network switches, power and cooling equipment (counted in the Poland Data Center Infrastructure Market), public cloud storage subscriptions, and drives sold loose to server makers.
How the segments fit together: each of the four segment dimensions and the five regions add up to the same total in every year. The Poland Data Center Market covers the halls and all spending inside them; the Poland Data Center Storage Market counts only the storage layer of those halls, about 6% of that wider market in 2025.
Why Is This Estimate Five Times Smaller Than the Earlier Edition?
This edition rebuilds the Poland Data Center Storage Market bottom-up at USD 116.74 million for 2025 and USD 132.91 million for 2026, about 5.3 times smaller than the earlier DC Market Insights edition.
The earlier figure counted enterprise storage outside data halls, storage bought for branch offices and factories, and cloud storage subscriptions sold to Polish customers but served from halls abroad. This edition counts only systems installed in Polish halls, priced per megawatt of IT capacity. Published estimates for Polish data center storage differ widely for the same reason: some add memory and solid-state drive (SSD) component sales, others add backup-as-a-service revenue billed from other countries. Small and mid-sized enterprises (SMEs) stay in scope when their arrays sit in a Polish colocation hall, which is why the Industry and Others segment still holds 14% of 2025 value.
| Element | Counted here | Why |
|---|---|---|
| Arrays, file and object systems in Polish halls | Yes, USD 109.74 million in 2025 | Installed in the data hall |
| Tape and archive libraries | Yes, USD 7.00 million | Hall-based backup tier |
| Storage software and support | Yes, USD 42.03 million | Bought with the systems |
| Storage in offices and plants | No | Not in a data hall |
| Cloud storage subscriptions | No | Service revenue, often served abroad |
| Loose SSDs and memory chips | No | Component sales to server makers |
Market Drivers: Which Polish Projects Are Pulling Storage Demand Forward?
Poland adds 93 MW of new IT capacity across 2025 and 2026, which lifts annual storage spend by USD 24.60 million between 2024 and 2026, DC Market Insights estimates.
Microsoft’s PLN 2.8 Billion Poland Central Expansion
Microsoft said on 17 February 2025 that it intends to spend PLN 2.8 billion by June 2026 to expand cloud and AI infrastructure and to grow its existing datacenter campuses in Poland (Source: Microsoft). Cloud regions buy storage in large tranches as each hall opens, so the Cloud and Colocation Providers segment rises from USD 46.70 million in 2025 to USD 157.39 million by 2035.
Jawczyce and Duchnice Campuses: 103 MW of Planned IT Power West of Warsaw
Data4’s Jawczyce campus offers up to 60 MW of IT power 20 minutes from central Warsaw (Source: Data4), and Atman’s WAW-3 opened its first 14.4 MW building in September 2025 on a campus planned for 43 MW (Source: Atman). At USD 0.33 million per MW-year in 2026, the 103 MW of these two campuses carry about USD 34 million of storage spend a year once fully let, a DC Market Insights estimate.
DORA Restore Tests for Polish Banks
The Digital Operational Resilience Act (Regulation (EU) 2022/2554) has applied since 17 January 2025 and makes banks and insurers prove that critical systems can be restored from backups (Source: EUR-Lex). Polish banks answer with immutable backup copies and a second site, which keeps Banking Financial Services and Insurance at USD 23.35 million in 2025, the second-largest buyer group.
Market Trends: How Are Polish Buyers Changing the Storage They Buy?
Polish buyers are moving value from hybrid arrays to flash and object systems: Hybrid Flash Arrays fall from 30% to 17% of value by 2035, DC Market Insights estimates.
Object Storage for AI Datasets at 130 kW Racks in Poznań
Beyond.pl said in September 2024 that its new Poznań space is prepared for high-density IT of 130+ kW per rack (Source: Beyond.pl). Training data for such racks sits on object platforms, so Object Storage grows from USD 16.34 million in 2025 to USD 89.09 million by 2035, 18.48% a year.
Software and Support Take a Larger Share of Each Contract
Storage Software grows 12.26% a year against 8.52% for hardware, because replication, immutable snapshots and ransomware recovery tools are licensed per terabyte protected, a DC Market Insights estimate built on vendor subscription models.
Market Challenges: What Holds Back Polish Storage Spending?
Two forces cap the Poland Data Center Storage Market at a 9.79% CAGR even as installed IT capacity triples from 342 MW in 2025 to 1,061 MW in 2035.
Falling Storage Spend per Megawatt
Storage spend per average installed megawatt falls from USD 0.400 million in 2020 to USD 0.343 million in 2025 and USD 0.253 million in 2035 in the DC Market Insights model, because flash density per drive keeps rising and AI halls hold more compute per terabyte. That 3% yearly fall removes about USD 3.8 million of 2026 spend against a case that holds the 2025 rate.
Two-Year Grace Period Before Cybersecurity Fines
The amended Act on the National Cybersecurity System (Krajowy System Cyberbezpieczeństwa, KSC), signed by the President on 19 February 2026, sets fines of up to EUR 10 million or 2% of turnover for essential entities, but fines apply only two years after the act enters into force (Source: Act on the National Cybersecurity System). Some public buyers will spread backup upgrades over that window, which holds Government and Public Sector growth to 9.08% a year.
Market Opportunities: Where Can Storage Suppliers Win New Polish Contracts?
Two openings are worth about USD 68.28 million of added annual spend between 2025 and 2035, DC Market Insights estimates.
The 150 MW Poznań Campus
Greater Poland grows from USD 14.01 million in 2025 to USD 56.42 million by 2035 as Beyond.pl’s campus moves toward 150 MW, with Data Center 2 alone targeted at 42 MW (Source: Beyond.pl). Suppliers that certify object and flash platforms for 130 kW AI tenants are best placed.
Public-Sector Backup Under the KSC
Government and Public Sector storage rises from USD 18.68 million in 2025 to USD 44.55 million by 2035 as ministries and municipal operators named as essential entities under the amended KSC buy backup copies that survive ransomware.
What Does Storage Cost per Megawatt in a Polish Data Center?
A Polish data hall spends about USD 0.343 million a year on storage for each megawatt of installed IT capacity in 2025, and an AI hall adds about USD 1.10 million of dataset storage per new megawatt, DC Market Insights estimates.
| Price point | 2020 | 2025 | 2030 | 2035 |
|---|---|---|---|---|
| Storage spend per average installed MW-year (USD million) | 0.400 | 0.343 | 0.295 | 0.253 |
| Storage per new AI MW (USD million) | 1.217 | 1.100 | 0.994 | 0.899 |
| Average installed IT capacity (MW) | 234 | 325 | 629 | 1,021 |
The Polish rate sits between the USD 0.361 million per MW-year used for the South Korea Data Center Storage Market and the USD 0.170 million used for the sanctions-hit Russia Data Center Storage Market, because Polish buyers pay EU list prices but run a larger share of older hybrid arrays than Korean hyperscale halls.
Which Rules Decide How Polish Data Centers Store and Back Up Data?
Four rules shape the USD 132.91 million that Polish halls spend on storage in 2026, most of all the backup and restore duties they place on banks and public operators.
- Act on the National Cybersecurity System (KSC), amended 2026: transposes the EU NIS2 Directive; signed on 19 February 2026, it enters into force one month after publication, with fines from two years after that (Source: Act on the National Cybersecurity System).
- Digital Operational Resilience Act (DORA), Regulation (EU) 2022/2554: applies since 17 January 2025 to banks, insurers and investment firms, including backup and restoration testing (Source: EUR-Lex).
- General Data Protection Regulation (GDPR), Regulation (EU) 2016/679: sets breach and retention duties that shape snapshot and deletion policies (Source: EUR-Lex).
- EU Data Act, Regulation (EU) 2023/2854: applies from 12 September 2025 and requires cloud providers to support switching, which favours portable object formats (Source: EUR-Lex).
Market Segmentation: Which Storage Type Carries the Most Value in Poland?
All-Flash Arrays carry the most value in the Poland Data Center Storage Market at USD 51.37 million, 44% of 2025 spend, and Object Storage is the fastest architecture at 18.48% a year.
By Storage Type: Flash Overtakes Hybrid in Polish Banks and Clouds
| Storage Type | 2025 (USD million) | Share 2025 | 2035 (USD million) | CAGR 2025-2035 |
|---|---|---|---|---|
| All-Flash Arrays | 51.37 | 44% | 184.12 | 13.62% |
| Hybrid Flash Arrays | 35.02 | 30% | 50.48 | 3.72% |
| HDD-Based and Distributed Systems | 23.35 | 20% | 47.52 | 7.36% |
| Tape and Archive Libraries | 7.00 | 6% | 14.85 | 7.81% |
By Architecture: Object Platforms Gain on SAN
| Architecture | 2025 (USD million) | Share 2025 | 2035 (USD million) | CAGR 2025-2035 |
|---|---|---|---|---|
| Storage Area Network (SAN) | 42.03 | 36% | 74.24 | 5.85% |
| Network-Attached and Scale-Out File | 30.35 | 26% | 80.18 | 10.20% |
| Object Storage | 16.34 | 14% | 89.09 | 18.48% |
| Direct-Attached and Hyperconverged | 28.02 | 24% | 53.45 | 6.67% |
By Component: Software Grows Faster Than Hardware
| Component | 2025 (USD million) | Share 2025 | 2035 (USD million) | CAGR 2025-2035 |
|---|---|---|---|---|
| Storage Hardware | 74.71 | 64% | 169.27 | 8.52% |
| Storage Software | 23.35 | 20% | 74.24 | 12.26% |
| Support and Managed Services | 18.68 | 16% | 53.45 | 11.09% |
By End User: Cloud and Colocation Providers Lead
| End User | 2025 (USD million) | Share 2025 | 2035 (USD million) | CAGR 2025-2035 |
|---|---|---|---|---|
| Cloud and Colocation Providers | 46.70 | 40% | 157.39 | 12.92% |
| Banking Financial Services and Insurance | 23.35 | 20% | 44.55 | 6.67% |
| Government and Public Sector | 18.68 | 16% | 44.55 | 9.08% |
| Telecom Operators | 11.67 | 10% | 20.79 | 5.94% |
| Industry and Others | 16.34 | 14% | 29.70 | 6.16% |
DC Exclusive: Poland Storage Pipeline Tracker, 3 Disclosed Campuses and 253 MW
The three Polish campuses with a disclosed IT target add up to 253 MW and would carry about USD 84.30 million of storage spend a year at the 2026 rate once fully let, a DC Market Insights estimate built on 6 inputs (three campus targets, the 2026 storage rate per MW-year, the AI storage rate and the Microsoft investment figure).
| Campus | Location | Planned IT MW | Storage spend at full load, 2026 rate (USD million a year) | Status and source facts |
|---|---|---|---|---|
| Beyond.pl Poznań campus | Poznań, Greater Poland | 150 | 49.98 | 86 MW target raised to 150 MW (Sep 2024); Data Center 2 at 42 MW; 130+ kW racks |
| Data4 Warsaw campus | Jawczyce, Masovia | 60 | 19.99 | Up to 60 MW of IT power on 4 ha |
| Atman WAW-3 | Duchnice near Ożarów Mazowiecki, Masovia | 43 | 14.33 | First building 14.4 MW opened Sep 2025; PLN 2.5 billion budget |
| Microsoft Poland Central expansion | Warsaw area, Masovia | n/d | n/d | PLN 2.8 billion by June 2026; MW not disclosed |
The tracker shows why the market more than doubles by 2035: the 253 MW pipeline equals 74% of Poland’s 342 MW installed base at the end of 2025, and Poznań alone holds 59% of it. Storage suppliers that win the first tenant halls at these three campuses lock in refresh cycles that run to the mid-2030s.
Regional Insights: Why Does Greater Poland Grow Faster Than Warsaw?
The Warsaw Metropolitan Area leads with USD 71.21 million, 61% of 2025 value, while Greater Poland grows fastest at 14.95% a year, DC Market Insights estimates.
Warsaw Metropolitan Area
Warsaw Metropolitan Area spends USD 71.21 million on data center storage in 2025, 61% of the national market, rising to USD 154.42 million by 2035 at 8.05% a year. Warsaw keeps the largest base because the Microsoft cloud region, the Equinix WA sites and the Data4 and Atman campuses sit within 30 kilometres of the city; its share still falls as new halls go elsewhere.
Greater Poland
Greater Poland spends USD 14.01 million on data center storage in 2025, 12% of the national market, rising to USD 56.42 million by 2035 at 14.95% a year. Greater Poland grows fastest because Beyond.pl’s Poznań campus targets 150 MW and racks above 130 kW, which need flash and object tiers for AI datasets.
Lesser Poland and Silesia
Lesser Poland and Silesia spends USD 14.01 million on data center storage in 2025, 12% of the national market, rising to USD 35.64 million by 2035 at 9.79% a year. Kraków, Skawina and Katowice serve banks’ shared-service centres and regional operators, so storage here leans on SAN arrays and backup libraries.
Pomerania and Northern Poland
Pomerania and Northern Poland spends USD 8.17 million on data center storage in 2025, 7% of the national market, rising to USD 23.76 million by 2035 at 11.26% a year. Gdańsk and Toruń host regional and university halls; EXEA’s Toruń site sits in the Toruń Technology Park.
Western and Central Poland
Western and Central Poland spends USD 9.34 million on data center storage in 2025, 8% of the national market, rising to USD 26.73 million by 2035 at 11.09% a year. Wrocław, Łódź and Szczecin host enterprise and colocation halls that serve manufacturers and business-service centres in the west and centre of the country.
Which Polish Cities Buy the Most Data Center Storage?
Warsaw buys the most data center storage in Poland at USD 39.69 million in 2025, and Poznań is the fastest-growing large location at 15.33% a year, DC Market Insights estimates.
| Rank | City or cluster | 2025 (USD million) | 2035 (USD million) | CAGR 2025-2035 | Region |
|---|---|---|---|---|---|
| 1 | Warsaw (city) | 39.69 | 74.24 | 6.46% | Warsaw Metropolitan Area |
| 2 | Ozarow Mazowiecki and Duchnice | 16.34 | 44.55 | 10.55% | Warsaw Metropolitan Area |
| 3 | Poznan | 12.84 | 53.45 | 15.33% | Greater Poland |
| 4 | Jawczyce and Raszyn | 11.67 | 29.70 | 9.79% | Warsaw Metropolitan Area |
| 5 | Krakow and Skawina | 7.00 | 17.82 | 9.79% | Lesser Poland and Silesia |
| 6 | Katowice and Upper Silesia | 5.84 | 14.85 | 9.78% | Lesser Poland and Silesia |
| 7 | Wroclaw | 5.25 | 14.85 | 10.96% | Western and Central Poland |
| 8 | Gdansk and Tricity | 4.67 | 13.36 | 11.08% | Pomerania and Northern Poland |
| 9 | Torun | 2.33 | 7.42 | 12.28% | Pomerania and Northern Poland |
| 10 | Lodz | 2.33 | 5.94 | 9.81% | Western and Central Poland |
| 11 | Szczecin | 1.75 | 5.94 | 13.00% | Western and Central Poland |
| 12 | Lublin | 1.17 | 2.97 | 9.76% | Lesser Poland and Silesia |
The suburban ring around Warsaw (Ożarów Mazowiecki, Duchnice, Jawczyce and Raszyn) grows faster than the city itself because the new campuses are built on larger plots outside the centre.
Forecast Scenarios: How Far Could Polish Storage Spend Go by 2035?
DC Market Insights puts the 2035 range for the Poland Data Center Storage Market at USD 237.58 million to USD 353.39 million, around a base case of USD 296.97 million.
| Scenario | Assumption from 2027 | 2035 (USD million) | CAGR 2025-2035 |
|---|---|---|---|
| Low | New IT capacity about 15% below base and storage rate 5% lower as grid connections slow | 237.58 | 7.36% |
| Base | 85 MW of new IT capacity in 2030 and 95 MW in 2035; AI share 45% of new capacity by 2035 | 296.97 | 9.79% |
| High | Poznań and Warsaw campuses fill early; new capacity about 14% above base and storage rate 5% higher | 353.39 | 11.71% |
Key Players and Market Share: Who Supplies Storage to Polish Data Centers?
Dell Technologies, Hewlett Packard Enterprise (HPE) and NetApp hold about 41% of external array spend in Polish data halls together, a DC Market Insights estimate based on the installed base at colocation and bank sites; the rest is split among about a dozen suppliers and Polish integrators.
- Dell Technologies
- Hewlett Packard Enterprise (HPE)
- NetApp
- IBM
- Pure Storage
- Hitachi Vantara
- Huawei Technologies
- Lenovo
- Fujitsu
- Nutanix
- Quantum Corporation
- Veeam Software
- Commvault
- Asseco Poland
- Comarch
Polish integrators such as Asseco Poland and Comarch resell and manage arrays for banks and public bodies, while colocation operators including Atman, Beyond.pl, Data4, EXEA and Equinix are the halls in which most new storage is installed. Backup software from Veeam Software and Commvault rides on the DORA and KSC restore duties, which is why Storage Software reaches USD 74.24 million by 2035.
Recent Developments in Poland Data Center Storage, 2024-2026
Five dated events between September 2024 and February 2026 set the pace for the USD 132.91 million that Polish halls spend on storage in 2026, a DC Market Insights estimate.
- In September 2024, Beyond.pl raised the target capacity of its Poznań campus from 86 MW to 150 MW and prepared new space for 130+ kW racks (Source: Beyond.pl).
- In January 2025, the Digital Operational Resilience Act began to apply to Polish banks and insurers on 17 January (Source: EUR-Lex).
- In February 2025, Microsoft announced PLN 2.8 billion for cloud and AI infrastructure in Poland by June 2026 (Source: Microsoft).
- In September 2025, Atman opened the first 14.4 MW building of its 43 MW WAW-3 campus near Warsaw (Source: Atman).
- In February 2026, the President of Poland signed the amended Act on the National Cybersecurity System on 19 February (Source: Act on the National Cybersecurity System).
Methodology: How the Model Builds USD 116.74 million From 325 Megawatts
DC Market Insights builds the Poland Data Center Storage Market from 16 years of capacity data and 2 unit rates: 325 MW of average installed IT capacity × USD 0.343 million per MW-year = USD 111.73 million, plus 4.56 MW of new AI capacity × USD 1.10 million = USD 5.01 million, giving USD 116.74 million for 2025.
- Capacity: new IT capacity of 20 MW (2020), 38 MW (2025), 85 MW (2030) and 95 MW (2035); installed base retires 1.5% a year, reaching 342 MW at the end of 2025 and 1,061 MW at the end of 2035.
- Rates: USD 0.400 million per MW-year in 2020, falling 3% a year; AI dataset storage USD 1.10 million per new AI MW in 2025, falling 2% a year; AI share of new capacity 12% in 2025, 35% in 2030 and 45% in 2035.
- Splits: 4 segment dimensions, 5 regions and 12 cities, each summing to the total in every year.
Three bound checks: (1) ceiling: USD 116.74 million is about 6% of the USD 1.97 billion Poland Data Center Market (earlier DC Market Insights edition) in 2025, in line with storage’s share of data-hall spending; (2) ceiling: the USD 0.343 million rate stays below the USD 0.361 million used for South Korea; (3) floor: the more than 200 MW of commercial capacity counted by the Polish Data Center Association (PLDCA) for 2024, at the Russian rate of USD 0.170 million, already gives USD 34 million, so the result cannot sit far below the modelled value. Full method: research methodology.
Table of contents
- 01Key Market Statistics: Poland's USD 132.91 million Storage Year in Ten Figures
- 1.1Market Snapshot, 2025, 2026 and 2035
- 02Key Takeaways: What the Warsaw and Poznań Build-Out Means for Storage Buyers
- 2.1Four Numbers for Storage Buyers
- 03Executive Summary: How Has Polish Data Center Storage Spend Moved Since 2020?
- 3.1Market Size, 2020-2035
- 3.2Installed-Base and AI Storage Lines
- 04Which Storage Systems Inside Polish Data Halls Does the Market Count?
- 4.1Included
- 4.2Excluded
- 4.3How the Segments Fit Together
- 05Why Is This Estimate Five Times Smaller Than the Earlier Edition?
- 5.1Earlier Edition vs This Edition
- 5.2Scope Table
- 06Market Drivers: Which Polish Projects Are Pulling Storage Demand Forward?
- 6.1Microsoft's PLN 2.8 Billion Poland Central Expansion
- 6.2Jawczyce and Duchnice Campuses: 103 MW of Planned IT Power West of Warsaw
- 6.3DORA Restore Tests for Polish Banks
- 07Market Trends: How Are Polish Buyers Changing the Storage They Buy?
- 7.1Object Storage for AI Datasets at 130 kW Racks in Poznań
- 7.2Software and Support Take a Larger Share of Each Contract
- 08Market Challenges: What Holds Back Polish Storage Spending?
- 8.1Falling Storage Spend per Megawatt
- 8.2Two-Year Grace Period Before Cybersecurity Fines
- 09Market Opportunities: Where Can Storage Suppliers Win New Polish Contracts?
- 9.1The 150 MW Poznań Campus
- 9.2Public-Sector Backup Under the KSC
- 10What Does Storage Cost per Megawatt in a Polish Data Center?
- 10.1Storage Spend per MW-Year, 2020-2035
- 10.2Rate Comparison With South Korea and Russia
- 11Which Rules Decide How Polish Data Centers Store and Back Up Data?
- 11.1Act on the National Cybersecurity System (KSC)
- 11.2Digital Operational Resilience Act (DORA)
- 11.3General Data Protection Regulation (GDPR)
- 11.4EU Data Act
- 12Market Segmentation: Which Storage Type Carries the Most Value in Poland?
- 12.1By Storage Type: All-Flash Arrays, Hybrid Flash Arrays, HDD-Based and Distributed Systems, Tape and Archive Libraries
- 12.2By Architecture: Storage Area Network (SAN), Network-Attached and Scale-Out File, Object Storage, Direct-Attached and Hyperconverged
- 12.3By Component: Storage Hardware, Storage Software, Support and Managed Services
- 12.4By End User: Cloud and Colocation Providers, Banking Financial Services and Insurance, Government and Public Sector, Telecom Operators, Industry and Others
- 13DC Exclusive: Poland Storage Pipeline Tracker, 3 Disclosed Campuses and 253 MW
- 13.1Beyond.pl Poznań Campus
- 13.2Data4 Warsaw Campus
- 13.3Atman WAW-3
- 13.4Microsoft Poland Central Expansion
- 14Regional Insights: Why Does Greater Poland Grow Faster Than Warsaw?
- 14.1Warsaw Metropolitan Area
- 14.2Greater Poland
- 14.3Lesser Poland and Silesia
- 14.4Pomerania and Northern Poland
- 14.5Western and Central Poland
- 15Which Polish Cities Buy the Most Data Center Storage?
- 15.1Warsaw (city)
- 15.2Ozarow Mazowiecki and Duchnice
- 15.3Poznan
- 15.4Jawczyce and Raszyn
- 15.5Krakow and Skawina
- 15.6Katowice and Upper Silesia
- 15.7Wroclaw
- 15.8Gdansk and Tricity
- 15.9Torun
- 15.10Lodz
- 15.11Szczecin
- 15.12Lublin
- 16Forecast Scenarios: How Far Could Polish Storage Spend Go by 2035?
- 16.1Low Scenario
- 16.2Base Scenario
- 16.3High Scenario
- 17Key Players and Market Share: Who Supplies Storage to Polish Data Centers?
- 17.1Dell Technologies
- 17.2Hewlett Packard Enterprise (HPE)
- 17.3NetApp
- 17.4IBM
- 17.5Pure Storage
- 17.6Hitachi Vantara
- 17.7Huawei Technologies
- 17.8Lenovo
- 17.9Fujitsu
- 17.10Nutanix
- 17.11Quantum Corporation
- 17.12Veeam Software
- 17.13Commvault
- 17.14Asseco Poland
- 17.15Comarch
- 18Recent Developments in Poland Data Center Storage, 2024-2026
- 18.1Dated Events, September 2024 to February 2026
- 19Methodology: How the Model Builds USD 116.74 million From 325 Megawatts
- 19.1Capacity Cohort Model
- 19.2Unit Rates
- 19.3Bound Checks
- Fig. 1Poland Data Center Storage Market Size, 2020-2035 (USD million)
- Table 1Market attributes, 2025, 2026 and 2035
- Table 2Scope of the Poland Data Center Storage Market
- Table 3Storage spend per megawatt, 2020-2035
- Table 4Market by Storage Type, 2025 and 2035
- Table 5Market by Architecture, 2025 and 2035
- Table 6Market by Component, 2025 and 2035
- Table 7Market by End User, 2025 and 2035
- Table 8Poland Storage Pipeline Tracker
- Table 9Top 12 cities and clusters, 2025 and 2035
- Table 10Forecast scenarios, 2035
About this report
Written by Amit Jain and reviewed by Deepti Agrawal, Senior Editor, Research. Figures are built top-down and bottom-up and reconciled before publication, with 2025 as the base year.
Read our methodologyHow we built this
- Historical period2020-2024
- Base year2025
- Forecast period2026-2035
- Sizing approachTop-down + bottom-up
Need more than the report?
Advisory on this market
Due diligence, site selection and market entry work, by the analysts who wrote this report.
See consulting servicesFrequently asked questions
USD 132.91 million in 2026, up 13.85% from USD 116.74 million in 2025, according to DC Market Insights estimates. The market is projected to reach USD 296.97 million by 2035, a CAGR of 9.79% from 2025.
USD 116.74 million is the 2025 value when only storage installed in Polish data halls is counted. The earlier edition also counted office and plant storage and cloud subscriptions served from abroad, so it came out about 5.3 times larger.
All-flash arrays, with USD 51.37 million or 44% of 2025 value, rising to 62% by 2035 as banks replace hybrid arrays to meet DORA restore tests (DC Market Insights estimate).
Object storage, at 18.48% a year from USD 16.34 million in 2025 to USD 89.09 million by 2035, because AI tenants in Poznań and Warsaw keep training datasets on object platforms.
Greater Poland, at 14.95% a year, because Beyond.pl’s Poznań campus target rose from 86 MW to 150 MW. The Warsaw Metropolitan Area still leads with 61% of 2025 value.
About USD 0.343 million a year per megawatt of installed IT capacity in 2025, plus about USD 1.10 million per new AI megawatt, according to DC Market Insights estimates; the per-megawatt rate falls 3% a year.
Three campuses with 253 MW of planned IT power: Beyond.pl Poznań (150 MW), Data4 Jawczyce (60 MW) and Atman WAW-3 (43 MW), plus Microsoft’s PLN 2.8 billion cloud expansion due by June 2026.
USD 23.35 million of 2025 storage spend comes from banks and insurers, who must prove restores under DORA since 17 January 2025; the amended KSC, signed 19 February 2026, adds backup duties for essential entities.
About 41% of external array spend goes to Dell Technologies, Hewlett Packard Enterprise and NetApp together (DC Market Insights estimate); IBM, Pure Storage, Hitachi Vantara, Huawei and Lenovo follow, with Asseco Poland and Comarch as integrators.
Between USD 237.58 million and USD 353.39 million, with a base case of USD 296.97 million, depending on how fast the Warsaw and Poznań campuses fill (DC Market Insights estimate).
Get this report
How do I get the full report?
Request a quote; we reply by email within one business day.
How and when will I receive the report?
By email, within 24-48 business hours of payment.
How can I pay?
Once you accept the quote, we email you a secure payment link.
Can I see a sample first?
Yes. Request a free sample and we will email it to you.
Can the report be tailored to my needs?
Yes. We can add countries, segments or data cuts. Talk to an analyst about the scope you need.
Can I get an invoice or pay against a purchase order?
Write to sales@dcmarketinsights.com and our team will help.