
Indonesia Data Center Colocation Market Size, Share & Forecast to 2035
Market at a glance
The Indonesia Data Center Colocation market was worth USD 452.4 million in 2025 and is forecast to reach USD 2,310.0 million by 2035, growing at a 17.73% CAGR.
 By Amit Jain, Senior Consultant, ICT & Emerging Technologies
 Reviewed by Deepti Agrawal
Last updated 19 Oct 2026
Base year 2025 PDF + Excel
What is inside the report
- 01Key Market Statistics
- 02Executive Summary
- 03Market Scope
- 04Why Estimates Differ
- 05Market Drivers
- 06Market Trends
- 07Market Challenges
- 08Market Opportunities
- 09Pricing
- 10Standards and Regulation
- 19chapters
- 2020-2024Historical period
- 2026-2035Forecast period
- —Companies profiled
Segmentation
Full analysis
The Indonesia Data Center Colocation Market is valued at USD 560.87 million in 2026 and is projected to reach USD 2.31 billion by 2035, up from USD 452.40 million in 2025, a CAGR of 17.73% from 2025 to 2035 (DC Market Insights estimate). The money in this market moves with one ratio: how many megawatts (MW) of Indonesian IT load sit in third-party halls rather than in owner-built rooms, and Government Regulation (PP) 71/2019 keeps that load onshore by requiring public-scope electronic systems and data to be stored in Indonesia. The Ministry of Communication and Digital Affairs (Komdigi) counted 185 data centers with 274 MW in August 2025 and set a target of more than 2,000 MW by 2029, so the 2026 step-up of 23.98% comes from new halls in Cibitung, Karawang and Batam opening faster than tenants can fill them. Indonesia data center colocation covers the rent, power and cross-connect revenue that operators earn from tenants for space in shared facilities: 312 leased MW in 2025 at about USD 1.45 million per leased MW-year gives the USD 452.40 million base. AI and graphics processing unit (GPU) density halls above 30 kilowatts (kW) per rack grow fastest at 35.24% a year, and Batam and the Riau Islands is the fastest region at 27.51% because its campuses sell power and land that Greater Jakarta can no longer offer at scale.
Key Market Statistics: How Big Is the Indonesia Data Center Colocation Market in 2026?
DC Market Insights values Indonesia data center colocation at USD 560.87 million in 2026, 23.98% more than the USD 452.40 million earned in 2025.
- Market size 2025: USD 452.40 million (DC Market Insights estimate).
- Market size 2026: USD 560.87 million.
- Market size 2030: USD 1.21 billion.
- Market size 2035: USD 2.31 billion.
- CAGR 2025 to 2035: 17.73% in the base case, 15.13% in the low case and 20.09% in the high case.
- Largest segment: wholesale colocation, 58.0% of 2025 value (USD 262.39 million).
- Fastest segment: AI and GPU density halls, 35.24% a year to USD 925.59 million by 2035.
- Leading region: Greater Jakarta, 80.0% of 2025 value (USD 361.92 million); fastest region: Batam and Riau Islands at 27.51%.
- Largest hub: Bekasi and Cibitung, USD 135.72 million in 2025.
- Market leader: DCI Indonesia, about 34% of 2025 colocation revenue (DC Market Insights assessment from its audited revenue).
How Fast Is Indonesia Data Center Colocation Revenue Growing from 2020 to 2035?
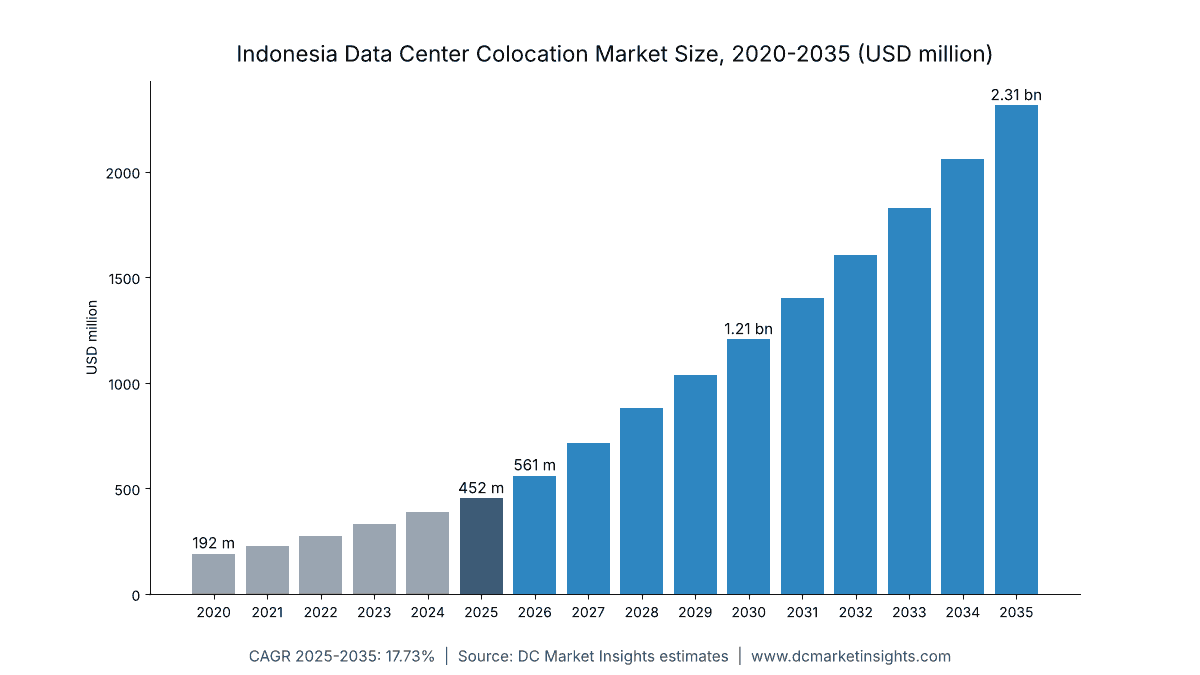
The Indonesia Data Center Colocation Market size was valued at USD 191.51 million in 2020, reached USD 452.40 million in 2025, and is anticipated to reach USD 2.31 billion by 2035, at a CAGR of 17.73% during the forecast period.
| Attribute | Value |
|---|---|
| Historical period | 2020-2024 |
| Base year | 2025 |
| Forecast period | 2026-2035 |
| Market size 2025 | USD 452.40 million |
| Market size 2026 | USD 560.87 million |
| CAGR 2025-2035 | 17.73% |
| Market size 2035 | USD 2.31 billion |
Revenue grew 18.76% a year from 2020 to 2025 as installed IT capacity rose from about 220 MW to about 500 MW (DC Market Insights estimate, consistent with the Indonesia Data Center Market report). Growth slows to 17.73% a year after 2025 because realised revenue per leased MW eases from USD 1.45 million to USD 1.38 million as hyperscale wholesale deals take a larger share, even as leased capacity rises more than fivefold from 312 MW to 1,677 MW.
Analyst takeaway: 2026 adds USD 108.47 million of revenue, the largest single-year gain so far, because about 190 MW of new halls open in one year; occupancy dips to 72% before it recovers to 78% by 2030.
What Does Indonesia Data Center Colocation Include, and Where Does It Stop?
Indonesia data center colocation is the USD 452.40 million of 2025 revenue that third-party operators earned from renting space, power and interconnection inside Indonesian facilities.
Included
Wholesale colocation (powered shells and dedicated data halls leased by the MW, typically to cloud providers on 5 to 15 year terms), retail colocation (cabinets, cages and suites leased by the rack or kW), metered and pass-through power billed by the operator, cross-connects and meet-me-room fees, and remote-hands services sold with the space.
Excluded
Self-built enterprise and government data centers, the national data center program itself, public cloud service revenue (the cloud provider’s revenue, not the rent it pays), managed hosting and managed services sold on top of the space, and the equipment installed inside the halls. Rack enclosures belong to the Indonesia Data Center Racks Market: that report counts the hardware a tenant buys, while the colocation figures here count the rent the tenant pays for the cabinet position and its power.
How the Segments Fit Together
Every dimension adds up to the same USD 452.40 million in 2025 and USD 2.31 billion in 2035: two colocation types, three rack-density bands, six tenant groups, five regions and twelve hubs.
Why Do Indonesia Data Center Colocation Market Estimates Differ?
Published figures for Indonesia data center colocation range from below USD 500 million to more than USD 1.5 billion for 2025, and DC Market Insights puts 2026 at USD 560.87 million because it counts only third-party rent, power and interconnection.
Broader definitions add managed hosting and cloud services delivered from colocated racks, the value of the IT equipment inside the halls, construction spend on halls not yet open, and the self-built facilities of banks, telecom carriers and government agencies. The earlier edition of this page used a wider basket of that kind. This edition also excludes managed services and hybrid IT bundles, which DC Market Insights counts in its hosting coverage, while small and medium-sized enterprises (SMEs) renting single cabinets remain in scope through the retail segment.
| Element | Counted here | Why |
|---|---|---|
| Wholesale MW leases | Yes, USD 262.39 million (2025) | Rent paid to a third-party operator |
| Retail cabinets and cages, incl. SMEs | Yes, USD 190.01 million (2025) | Rent paid to a third-party operator |
| Managed hosting and cloud services | No | Service revenue on top of the space |
| IT and facility equipment | No | Counted in equipment markets |
| Self-built enterprise and government halls | No | No colocation contract exists |
What Is Driving Demand for Indonesia Data Center Colocation?
Three Indonesia-specific forces explain most of the USD 1.86 billion of revenue added between 2025 and 2035.
Data Residency Under PP 71/2019 and the OJK Banking Rules
Article 20 of PP 71/2019 requires public-scope electronic system operators to manage, process and store their systems and data in Indonesia, and the Financial Services Authority (OJK) requires banks to place their electronic systems in data centers and disaster recovery centers inside Indonesia under OJK Regulation (Peraturan OJK, POJK) 11/POJK.03/2022. OJK’s implementing rule PADK 1/2026 (Peraturan Anggota Dewan Komisioner, a Board of Commissioners member regulation), effective 1 March 2026, lets a bank move to a site OJK has already approved with only a notification (Source: OJK). DC Market Insights estimates banks and financial services rented USD 67.86 million of colocation in 2025, and government and public sector tenants USD 27.14 million; the faster approval path shortens bank migrations into approved third-party halls.
Hyperscale Cloud Regions Renting Wholesale Halls
Amazon Web Services (AWS) launched its Asia Pacific (Jakarta) Region in December 2021 and plans to invest an estimated USD 5 billion in Indonesia over 15 years (Source: Amazon). Microsoft opened its Indonesia Central cloud region with three availability zones in May 2025 as part of USD 1.7 billion planned for 2024-2028 (Source: Microsoft). Google Cloud opened its Jakarta region with three zones in June 2020 (Source: Google Cloud). Each availability zone needs separate leased halls; cloud and hyperscale providers paid USD 208.10 million in 2025, 46.0% of the market, of which DC Market Insights places USD 187.29 million in wholesale contracts.
Komdigi’s 2,000 MW Target and the Push Beyond Jakarta
Komdigi counted 274 MW in August 2025 and targets more than 2,000 MW by 2029, while saying it does not want to add new regulation and wants capacity to spread east to Surabaya and Makassar (Source: Komdigi, August 2025). DC Market Insights models Java outside Greater Jakarta growing 19.56% a year to 7.0% of the market by 2035, and the rest of Indonesia growing 26.18% a year to 4.0%.
Analyst takeaway: USD 948.89 million of new rent comes from cloud providers by 2035, because each new availability zone in Jakarta is leased, not built, by the three cloud regions already live.
Which Trends Are Reshaping Indonesia Colocation Halls?
Three trends shape the mix, and AI-density halls alone add USD 880.35 million of revenue between 2025 and 2035.
Sovereign AI Clouds Moving Into Liquid-Ready Halls
Indosat Ooredoo Hutchison’s subsidiary Lintasarta built its GPU Merdeka sovereign AI cloud in under three months inside a renewable-powered AI data center operated by the BDx Indonesia joint venture, according to NVIDIA in November 2024. DC Market Insights expects AI and GPU density halls to grow from USD 45.24 million (10.0% of 2025 value) to USD 925.59 million by 2035 (40.0%).
Batam Campuses Selling Out Before Opening
NeutraDC, Telkom Indonesia’s data center arm, topped off its Nxera Batam 1 (BTM-1) building with Singtel’s Nxera and Medco on 30 October 2025 with 18 MW of initial IT load, scalable to 54 MW, and reported in June 2026 that the whole BTM-1 capacity was committed before launch (Source: NeutraDC). DC Market Insights expects Batam’s share of national colocation revenue to rise from 9.0% in 2025 to 20.0% in 2035.
Interconnection-Led Retail in the Jakarta Central Business District
Equinix opened JK1 in Jakarta’s central business district (CBD) on 15 May 2025 with 550 cabinets in phase one and 1,600 at full build (Source: Equinix), and Digital Edge’s EDGE2 in South Jakarta offers 23 MW and more than 3,400 racks under 3 km from EDGE1, home of the IIX and EPIX exchanges (Source: Digital Edge). The Jakarta CBD hub earned USD 90.48 million in 2025 from network-dense retail space.
What Holds Back Indonesia Data Center Colocation Growth?
Two constraints cut the 2035 base case of USD 2.31 billion to USD 1.85 billion in the low case.
Grid Connections and the Renewable Supply Gap
PLN’s Electricity Supply Business Plan (RUPTL) 2025-2034 adds 69.5 GW of generation and storage by 2034, 76% of it renewables and storage, according to PLN’s June 2026 corporate presentation, but large connections for data centers are negotiated site by site. DC Market Insights holds occupancy at 72% in 2026 and 74% in 2027 because energised MW arrive in blocks of 18 to 36 MW while tenants move in by the rack.
Price Pressure From Hyperscale Contracts
Wholesale tenants pay about USD 102 per kW per month in 2025 against about USD 162 for retail space (DC Market Insights estimates), and the wholesale share of revenue rises from 58.0% to 67.0% by 2035. Blended revenue per leased MW therefore falls 4.8% from USD 1.45 million to USD 1.38 million, holding market growth below the 18.3% a year growth in leased MW.
Where Are the Best Openings for Indonesia Colocation Operators?
Two openings carry USD 1.16 billion of 2035 value between them.
Bank and Government Disaster-Recovery Suites
Banks, insurers and government agencies rented USD 95.00 million of colocation in 2025 (DC Market Insights estimate). Retail suites for primary and disaster recovery sites, approved once by OJK and reused under PADK 1/2026, carry USD 416.52 million of 2035 value for banking and public-sector tenants combined.
AI Halls in Karawang and Batam
DCI Indonesia lists its H2 Karawang campus at more than 600 MW of potential capacity (Source: DCI Indonesia), and Princeton Digital Group plans a 120 MW JC3 campus at GIIC Deltamas in Cikarang (Source: Princeton Digital Group). DC Market Insights expects Karawang to grow 21.16% a year to 12.0% of national colocation revenue by 2035, and Batam to 20.0%.
What Does Indonesia Data Center Colocation Cost per kW?
Blended Indonesia data center colocation revenue was about USD 120.8 per leased kW per month in 2025, USD 1.45 million per leased MW-year (DC Market Insights estimate).
| Year | Blended (USD per kW-month) | Wholesale (USD per kW-month) | Retail (USD per kW-month) | Revenue per leased MW-year (USD million) |
|---|---|---|---|---|
| 2020 | 129.2 | 110.0 | 156.5 | 1.55 |
| 2025 | 120.8 | 102.0 | 162.0 | 1.45 |
| 2030 | 116.7 | 100.0 | 163.1 | 1.40 |
| 2035 | 115.0 | 101.0 | 160.0 | 1.38 |
The public anchor is DCI Indonesia’s audited revenue: Rp 2,540.03 billion in 2025, up from Rp 1,812.45 billion in 2024 (Source: DCI Indonesia financial statements), across an IT load that rose from 119 MW to 128 MW. At Rp 16,300 per USD that is about USD 1.26 million per built MW, or about USD 1.48 million per leased MW at 85% occupancy, close to the market-wide USD 1.45 million. Power is billed at cost plus margin, and the Ministry of Energy and Mineral Resources (ESDM) kept tariffs unchanged for all 13 non-subsidised customer groups for the second quarter of 2026, which kept the power part of colocation bills flat.
Analyst takeaway: USD 59 per kW-month separates retail from wholesale space in 2025, because retail tenants pay for cross-connects, smaller power blocks and shorter terms.
Which Rules and Standards Govern Indonesia Data Center Colocation?
Four instruments shape where USD 452.40 million of 2025 colocation demand can go.
- Government Regulation (PP) 71/2019 on electronic systems: Article 20 keeps public-scope systems and data in Indonesia; offshore storage only where the technology is not available domestically.
- Law 27/2022 on Personal Data Protection (UU PDP), effective 17 October 2022 with a two-year transition, which pushes private operators to document where personal data sits.
- POJK 11/POJK.03/2022 and OJK PADK 1/2026 (effective 1 March 2026) for bank data centers and disaster recovery centers.
- Komdigi’s voluntary Sustainable Data Center Standard, drafted with the Indonesia Data Center Provider Organization (IDPRO) in August 2025, which Komdigi says is not new regulation (Source: Komdigi).
Tenants also ask for ISO/IEC 27001 certification, ANSI/TIA-942 ratings and Uptime Institute Tier certification of design and construction in tenders; DC Market Insights finds them in most wholesale requests for proposal.
Which Indonesia Data Center Colocation Segment Leads?
Wholesale colocation leads Indonesia data center colocation with USD 262.39 million in 2025, 58.0% of the market, and AI and GPU density halls grow fastest at 35.24% a year.
Analyst takeaway: 40.0% of 2035 revenue sits in AI and GPU density halls, up from 10.0%, because each liquid-ready hall rents at the same per-kW price but packs four times the power into a cabinet.
By Colocation Type: Wholesale or Retail?
Wholesale colocation earned USD 262.39 million in 2025, 58.0% of Indonesia data center colocation, and grows 19.44% a year because cloud regions lease whole halls; retail colocation earned USD 190.01 million and grows 14.92%.
| Colocation Type | 2025 | Share 2025 | 2035 | CAGR 2025-2035 |
|---|---|---|---|---|
| Wholesale Colocation | USD 262.39 million | 58.0% | USD 1.55 billion | 19.44% |
| Retail Colocation | USD 190.01 million | 42.0% | USD 763.61 million | 14.92% |
By Rack Density: How Much Power per Rack?
Standard-density space below 10 kW per rack still carried USD 280.49 million in 2025, 62.0% of the market, but AI and GPU density halls above 30 kW grow 35.24% a year and reach 40.0% of revenue by 2035.
| Rack Density | 2025 | Share 2025 | 2035 | CAGR 2025-2035 |
|---|---|---|---|---|
| Standard Density (below 10 kW per rack) | USD 280.49 million | 62.0% | USD 694.19 million | 9.49% |
| High Density (10 to 30 kW per rack) | USD 126.67 million | 28.0% | USD 694.19 million | 18.54% |
| AI and GPU Density (above 30 kW per rack) | USD 45.24 million | 10.0% | USD 925.59 million | 35.24% |
By Tenant: Who Rents Indonesian Colocation Space?
Cloud and hyperscale providers paid USD 208.10 million in 2025, 46.0% of the market; manufacturing and other enterprises grow fastest among tenants at 20.39% a year as factories in Cikarang and Karawang move systems into nearby halls.
| Tenant | 2025 | Share 2025 | 2035 | CAGR 2025-2035 |
|---|---|---|---|---|
| Cloud and Hyperscale Providers | USD 208.10 million | 46.0% | USD 1.16 billion | 18.72% |
| Banking and Financial Services | USD 67.86 million | 15.0% | USD 254.54 million | 14.13% |
| Telecom and IT Services | USD 58.81 million | 13.0% | USD 231.40 million | 14.68% |
| Digital Platforms and E-commerce | USD 54.29 million | 12.0% | USD 277.68 million | 17.73% |
| Government and Public Sector | USD 27.14 million | 6.0% | USD 161.98 million | 19.56% |
| Manufacturing and Other Enterprises | USD 36.19 million | 8.0% | USD 231.40 million | 20.39% |
DC Exclusive: The Greater Jakarta and Batam Colocation Supply Tracker, 10 Campuses and 239 MW
This DC Market Insights tracker lists 10 named campuses with about 239 MW operating or committed, built from 14 inputs in operator filings and releases, and adds the colocation type by tenant matrix that the model uses for 2025.
| Campus | Operator | Hub | Announced IT capacity | Status (source) |
|---|---|---|---|---|
| JK1-JK6, H1 Cibitung | DCI Indonesia | Bekasi and Cibitung | 128 MW group IT load (end 2025); H1 scalable to 220 MW | JK6 added 36 MW in 2025 (DCI Indonesia annual report) |
| E2 Surabaya | DCI Indonesia | Surabaya | 9 MW | Inaugurated 6 April 2026 (DCI Indonesia) |
| H2 Karawang | DCI Indonesia | Karawang | 600 MW+ potential | Planned (DCI Indonesia) |
| Nxera Batam BTM-1 | NeutraDC, Nxera, Medco | Batam | 18 MW, to 54 MW; 100 MW campus | Fully committed before launch, June 2026 (NeutraDC) |
| EDGE2 Kuningan | Digital Edge (EDGE DC) | Jakarta CBD | 23 MW, 3,400+ racks | Ready for service February 2024 (Digital Edge) |
| JK1 Jakarta | Equinix (75%) and Astra (25%) | Jakarta CBD | 550 cabinets, to 1,600 | Opened 15 May 2025 (Equinix) |
| JC1 and JC2 | Princeton Digital Group | Bekasi and Cibitung | 26 MW | Operating (Princeton Digital Group) |
| JC3 Deltamas | Princeton Digital Group | Cikarang and Deltamas | 120 MW | Planned (Princeton Digital Group) |
| STT Jakarta 1, Bekasi campus | ST Telemedia Global Data Centres | Bekasi and Cibitung | 19.5 MW; campus up to 72 MW | Operating since Q2 2023 (STT GDC) |
| Jakarta 3 | NTT DATA | Bekasi and Cibitung | 15.2 MW, to 45 MW | Launched April 2022 (NTT DATA) |
The operating and committed figures in the tracker (128 + 9 + 18 + 23 + 26 + 19.5 + 15.2 MW, about 239 MW) equal 48% of the 500 MW installed base DC Market Insights uses for 2025; announced expansions (H2 Karawang, JC3, Batam phases, STT and NTT build-outs) add more than 880 MW of potential, about the same as the 880 MW of new capacity the model needs between 2025 and 2030, so the forecast depends on Karawang energising its first phases on time.
| Tenant (2025, USD million) | Wholesale Colocation | Retail Colocation | Total |
|---|---|---|---|
| Cloud and Hyperscale Providers | 187.29 | 20.81 | 208.10 |
| Banking and Financial Services | 21.32 | 46.54 | 67.86 |
| Telecom and IT Services | 21.56 | 37.25 | 58.81 |
| Digital Platforms and E-commerce | 22.74 | 31.55 | 54.29 |
| Government and Public Sector | 5.69 | 21.45 | 27.14 |
| Manufacturing and Other Enterprises | 3.79 | 32.40 | 36.19 |
| Total | 262.39 | 190.00 | 452.39 |
Which Data Center Providers in Indonesia Offer the Most Rack Capacity and Power per Cabinet for AI Deployments?
DCI Indonesia offers the most Indonesia data center colocation capacity, with 128 MW of IT load at the end of 2025, and the halls built for AI are the BDx Indonesia AI campus and the new Batam and Karawang buildings.
For rack count, Digital Edge’s EDGE2 offers more than 3,400 racks on 23 MW, an average of about 6.8 kW per rack, and Equinix JK1 reaches 1,600 cabinets at full build. For power per cabinet, AI tenants need more than 30 kW per rack; DC Market Insights counts USD 45.24 million of 2025 revenue in such halls, mostly in Bekasi, Cikarang and the BDx Indonesia AI factory that hosts Lintasarta’s GPU Merdeka cloud. Buyers comparing providers should ask for energised MW available within 12 months, liquid-cooling readiness and the PLN connection date, not only the campus master-plan figure. The Indonesia AI Data Center Market report covers the GPU and facility spend behind these halls.
Which Indonesian Region Leads Data Center Colocation?
Greater Jakarta leads Indonesia data center colocation with USD 361.92 million in 2025, 80.0% of the market, and Batam and the Riau Islands grows fastest at 27.51% a year to USD 462.80 million by 2035.
| Region | 2025 | Share 2025 | 2035 | CAGR 2025-2035 |
|---|---|---|---|---|
| Greater Jakarta | USD 361.92 million | 80.0% | USD 1.53 billion | 15.49% |
| Batam and Riau Islands | USD 40.72 million | 9.0% | USD 462.80 million | 27.51% |
| Java outside Greater Jakarta | USD 27.14 million | 6.0% | USD 161.98 million | 19.56% |
| Sumatra | USD 13.57 million | 3.0% | USD 69.42 million | 17.73% |
| Rest of Indonesia | USD 9.05 million | 2.0% | USD 92.56 million | 26.18% |
Greater Jakarta
Greater Jakarta’s USD 361.92 million spans the CBD interconnection hub and the Bekasi, Cibitung, Cikarang and Karawang industrial estates, where DCI Indonesia, Princeton Digital Group, STT GDC and NTT DATA run their largest halls; its share falls to 66.0% by 2035 as new land and power move to Karawang and Batam.
Batam and Riau Islands
Batam earned USD 40.72 million in 2025 and grows 27.51% a year, led by Nxera Batam’s 100 MW campus and DCI Indonesia’s planned Bintan park of more than 1 GW (Source: DCI Indonesia), both selling capacity to tenants that also serve Singapore.
Java outside Greater Jakarta
Surabaya, Semarang and Bandung earned USD 27.14 million in 2025; DCI Indonesia’s 9 MW E2 Surabaya site, opened in April 2026, is the first large carrier-neutral hall in East Java, and the region grows 19.56% a year.
Sumatra
Sumatra, centred on Medan, earned USD 13.57 million in 2025 from bank and telecom disaster recovery suites and grows 17.73% a year.
Rest of Indonesia
Makassar, Bali and the new capital region earned USD 9.05 million in 2025; Komdigi’s call to spread data centers east supports 26.18% annual growth to USD 92.56 million. Edge sites below 1 MW are covered in the Indonesia Edge Data Center Market report.
Which Indonesian Hubs Carry the Most Colocation Revenue?
Bekasi and Cibitung is the largest Indonesia data center colocation hub with USD 135.72 million in 2025, and Batam is the fastest large hub at 27.51% a year.
| Rank | Hub | 2025 | Share 2025 | 2035 | CAGR 2025-2035 |
|---|---|---|---|---|---|
| 1 | Bekasi and Cibitung | USD 135.72 million | 30.0% | USD 462.80 million | 13.05% |
| 2 | Jakarta CBD (Kuningan and Sudirman) | USD 90.48 million | 20.0% | USD 254.54 million | 10.90% |
| 3 | Cikarang and Deltamas | USD 54.29 million | 12.0% | USD 277.68 million | 17.73% |
| 4 | Karawang | USD 40.72 million | 9.0% | USD 277.68 million | 21.16% |
| 5 | Tangerang and BSD | USD 40.72 million | 9.0% | USD 254.54 million | 20.11% |
| 6 | Batam | USD 40.72 million | 9.0% | USD 462.80 million | 27.51% |
| 7 | Surabaya | USD 18.10 million | 4.0% | USD 115.70 million | 20.38% |
| 8 | Medan | USD 13.57 million | 3.0% | USD 69.42 million | 17.73% |
| 9 | Semarang | USD 4.52 million | 1.0% | USD 23.14 million | 17.74% |
| 10 | Bandung | USD 4.52 million | 1.0% | USD 23.14 million | 17.74% |
| 11 | Makassar | USD 4.52 million | 1.0% | USD 46.28 million | 26.19% |
| 12 | Bali and Other Cities | USD 4.52 million | 1.0% | USD 46.28 million | 26.19% |
What Could the Indonesia Data Center Colocation Market Be Worth in 2035 Under Each Scenario?
DC Market Insights puts Indonesia data center colocation between USD 1.85 billion and USD 2.82 billion in 2035, with USD 2.31 billion in the base case.
| Scenario | 2035 size | CAGR 2025-2035 | What it assumes |
|---|---|---|---|
| Low | USD 1.85 billion | 15.13% | Grid connections slip two years; Batam absorbs less Singapore overflow |
| Base | USD 2.31 billion | 17.73% | 2,620 MW installed by 2035, 80% third-party, 80% leased |
| High | USD 2.82 billion | 20.09% | Komdigi’s 2,000 MW reached by 2029 and AI halls at 45% of revenue |
Who Are the Leading Indonesia Data Center Colocation Providers?
DCI Indonesia holds about 34% of 2025 Indonesia data center colocation revenue, and the five largest operators about 65% (DC Market Insights assessment; basis: DCI Indonesia’s audited 2025 revenue of Rp 2,540.03 billion, about USD 155.83 million at Rp 16,300 per USD, against the USD 452.40 million market, and announced MW for the others).
- DCI Indonesia
- NeutraDC (Telkom Indonesia)
- BDx Indonesia (Indosat Ooredoo Hutchison, Lintasarta and BDx)
- Digital Edge (EDGE DC)
- Princeton Digital Group
- ST Telemedia Global Data Centres
- NTT DATA
- Equinix
- Nxera (Singtel)
- DayOne
- EdgeConneX
- Elitery
- Biznet
DCI Indonesia’s revenue reached Rp 1,777.42 billion in the first half of 2026, 33.2% above the Rp 1,334.12 billion of the first half of 2025 (Source: DCI Indonesia financial statements), a pace in line with the 23.98% market growth DC Market Insights models for 2026 once its new JK6 capacity is filled. Equinix holds 75% of its Indonesian joint venture with Astra (Source: Equinix, April 2023). DCI Indonesia lists 5 locations, 9 data centers and 132 MW of shell capacity on its corporate site.
Analyst takeaway: 65% top-five concentration in 2025 falls to about 55% by 2035 (DC Market Insights estimate), because Batam and Karawang campuses add new operators faster than the incumbents add Jakarta MW.
What Changed in Indonesia Data Center Colocation in 2025 and 2026?
Six dated events since May 2025 added or committed more than 60 MW of Indonesia data center colocation capacity.
- In May 2025, Equinix opened JK1 in Jakarta’s central business district (CBD) with 550 cabinets in phase one (Source: Equinix).
- In May 2025, Microsoft opened its Indonesia Central cloud region with three availability zones (Source: Microsoft).
- In August 2025, Komdigi reported 185 data centers with 274 MW and a target of more than 2,000 MW by 2029 (Source: Komdigi).
- In October 2025, NeutraDC topped off Nxera Batam BTM-1 with 18 MW of initial IT load (Source: NeutraDC).
- In April 2026, DCI Indonesia inaugurated its 9 MW E2 Surabaya data center (Source: DCI Indonesia).
- In June 2026, NeutraDC reported BTM-1 fully committed before launch and BTM-2 in preparation (Source: NeutraDC).
Methodology: How the Model Sizes the Indonesia Data Center Colocation Market
The model multiplies 500 MW of installed IT capacity in 2025 by a 78% third-party share, an 80% leased share and USD 1.45 million per leased MW-year, which gives USD 452.40 million; the same chain runs for every year from 2020 to 2035 with 6 inputs and 26 ledger facts.
Three bound checks hold the result. Ceiling one: if all 500 MW were leased at the retail rate of USD 162 per kW-month, revenue would be USD 972 million, above the model. Ceiling two: DCI Indonesia’s USD 155.83 million of 2025 revenue on 128 MW, scaled to the 390 MW of third-party capacity, gives about USD 475 million, within 5% of the model. Floor: Komdigi’s 274 MW, 80% leased at a wholesale-only USD 1.2 million per MW-year, gives USD 263 million, below the model. Splits by type, density, tenant, region and hub each sum to the total in 2025 and 2035. The full approach is set out in our research methodology, and the capacity base follows Komdigi’s August 2025 data center count and the Coordinating Ministry figures used in the parent report.
Analyst takeaway: USD 145 million of 2035 value moves with every 5-point change in 2035 occupancy, because 1,677 leased MW carry the forecast; that is why the tracker follows energised MW rather than master-plan MW.
Table of contents
- 01Key Market Statistics
- 1.1Market Size 2025, 2026, 2030 and 2035
- 1.2CAGR Base, Low and High Case
- 1.3Largest and Fastest Segment
- 1.4Leading Region and Market Leader
- 02Executive Summary
- 2.1Market Snapshot, 2025, 2026 and 2035
- 2.2Growth From 2020 to 2035
- 2.3Analyst Takeaway: 2026 Capacity Step-Up
- 03Market Scope
- 3.1Included
- 3.2Excluded
- 3.3How the Segments Fit Together
- 04Why Estimates Differ
- 4.1Broader Definitions
- 4.2Scope Comparison Table
- 05Market Drivers
- 5.1Data Residency Under PP 71/2019 and the OJK Banking Rules
- 5.2Hyperscale Cloud Regions Renting Wholesale Halls
- 5.3Komdigi's 2,000 MW Target and the Push Beyond Jakarta
- 06Market Trends
- 6.1Sovereign AI Clouds Moving Into Liquid-Ready Halls
- 6.2Batam Campuses Selling Out Before Opening
- 6.3Interconnection-Led Retail in the Jakarta CBD
- 07Market Challenges
- 7.1Grid Connections and the Renewable Supply Gap
- 7.2Price Pressure From Hyperscale Contracts
- 08Market Opportunities
- 8.1Bank and Government Disaster-Recovery Suites
- 8.2AI Halls in Karawang and Batam
- 09Pricing
- 9.1Price per kW-Month, 2020, 2025, 2030 and 2035
- 9.2DCI Indonesia Revenue Anchor
- 10Standards and Regulation
- 10.1Government Regulation 71/2019
- 10.2Law 27/2022 on Personal Data Protection
- 10.3POJK 11/2022 and OJK PADK 1/2026
- 10.4Komdigi Sustainable Data Center Standard
- 11Market Segmentation
- 11.1By Colocation Type: Wholesale Colocation
- 11.2By Colocation Type: Retail Colocation
- 11.3By Rack Density: Standard Density
- 11.4By Rack Density: High Density
- 11.5By Rack Density: AI and GPU Density
- 11.6By Tenant: Cloud and Hyperscale Providers
- 11.7By Tenant: Banking and Financial Services
- 11.8By Tenant: Telecom and IT Services
- 11.9By Tenant: Digital Platforms and E-commerce
- 11.10By Tenant: Government and Public Sector
- 11.11By Tenant: Manufacturing and Other Enterprises
- 12DC Exclusive: Greater Jakarta and Batam Colocation Supply Tracker
- 12.110 Named Campuses
- 12.2Colocation Type by Tenant Matrix, 2025
- 13AI Rack Capacity and Power per Cabinet
- 13.1Rack Count by Provider
- 13.2Power per Cabinet for AI
- 14Regional Insights
- 14.1Greater Jakarta
- 14.2Batam and Riau Islands
- 14.3Java outside Greater Jakarta
- 14.4Sumatra
- 14.5Rest of Indonesia
- 15Hub Analysis
- 15.1Bekasi and Cibitung
- 15.2Jakarta CBD (Kuningan and Sudirman)
- 15.3Cikarang and Deltamas
- 15.4Karawang
- 15.5Tangerang and BSD
- 15.6Batam
- 15.7Surabaya
- 15.8Medan
- 15.9Semarang
- 15.10Bandung
- 15.11Makassar
- 15.12Bali and Other Cities
- 16Forecast Scenarios
- 16.1Low Scenario
- 16.2Base Scenario
- 16.3High Scenario
- 17Competitive Insights
- 17.1DCI Indonesia
- 17.2NeutraDC (Telkom Indonesia)
- 17.3BDx Indonesia
- 17.4Digital Edge (EDGE DC)
- 17.5Princeton Digital Group
- 17.6ST Telemedia Global Data Centres
- 17.7NTT DATA
- 17.8Equinix
- 17.9Market Concentration
- 18Recent Developments
- 18.12025 Developments
- 18.22026 Developments
- 19Methodology
- 19.1Model Chain in Numbers
- 19.2Three Bound Checks
- Fig. 1Indonesia Data Center Colocation Market Size, 2020-2035
- Table 1Market Snapshot, 2025, 2026 and 2035
- Table 2Scope Comparison
- Table 3Price per kW-Month, 2020-2035
- Table 4Market by Colocation Type
- Table 5Market by Rack Density
- Table 6Market by Tenant
- Table 7Greater Jakarta and Batam Colocation Supply Tracker
- Table 8Colocation Type by Tenant Matrix, 2025
- Table 9Market by Region
- Table 10Market by Hub
- Table 11Forecast Scenarios, 2035
About this report
Written by Amit Jain and reviewed by Deepti Agrawal, Senior Editor, Research. Figures are built top-down and bottom-up and reconciled before publication, with 2025 as the base year.
Read our methodologyHow we built this
- Historical period2020-2024
- Base year2025
- Forecast period2026-2035
- Sizing approachTop-down + bottom-up
Need more than the report?
Advisory on this market
Due diligence, site selection and market entry work, by the analysts who wrote this report.
See consulting servicesFrequently asked questions
USD 560.87 million in 2026, up 23.98% from USD 452.40 million in 2025, according to DC Market Insights estimates. The market is projected to reach USD 2.31 billion by 2035, a CAGR of 17.73% from 2025.
17.73% a year from 2025 to 2035, after 18.76% a year from 2020 to 2025. Leased capacity grows 18.31% a year from 312 MW to 1,677 MW, while revenue per leased MW eases from USD 1.45 million to USD 1.38 million as wholesale deals grow.
About USD 120.8 per leased kW per month in 2025 on a blended basis (DC Market Insights estimate): about USD 102 for wholesale halls and about USD 162 for retail cabinets, including power billed by the operator.
Wholesale colocation, with USD 262.39 million or 58.0% of 2025 revenue, because cloud regions lease whole halls by the MW. Retail colocation earned USD 190.01 million and grows 14.92% a year.
DCI Indonesia, with 128 MW of IT load at the end of 2025, offers the most capacity. Digital Edge’s EDGE2 has more than 3,400 racks on 23 MW, and AI halls above 30 kW per rack earned USD 45.24 million in 2025 (DC Market Insights).
Greater Jakarta, with USD 361.92 million or 80.0% of 2025 revenue. Batam and the Riau Islands grows fastest at 27.51% a year to USD 462.80 million by 2035 as Nxera Batam and other campuses open.
DCI Indonesia holds about 34% of 2025 revenue (DC Market Insights assessment from its Rp 2,540.03 billion audited revenue). NeutraDC, BDx Indonesia, Digital Edge, Princeton Digital Group, STT GDC, NTT DATA and Equinix follow; the top five hold about 65%.
274 MW across 185 data centers in August 2025, according to Komdigi, which targets more than 2,000 MW by 2029. DC Market Insights uses about 500 MW installed in 2025 and 2,620 MW by 2035, 78% to 80% of it in third-party halls.
USD 560.87 million in 2026 counts only third-party rent, power and interconnection (DC Market Insights). Estimates that add managed hosting, cloud services, IT equipment or self-built bank and government halls come out larger.
Banks and the public sector rented USD 95.00 million of colocation in 2025 (DC Market Insights estimate), because PP 71/2019 keeps public-scope data onshore and OJK requires bank data centers in Indonesia; PADK 1/2026 eased moves to approved sites from 1 March 2026.
Get this report
How do I get the full report?
Request a quote; we reply by email within one business day.
How and when will I receive the report?
By email, within 24–48 business hours of payment.
How can I pay?
Once you accept the quote, we email you a secure payment link.
Can I see a sample first?
Yes. Request a free sample and we will email it to you.
Can the report be tailored to my needs?
Yes. We can add countries, segments or data cuts. Talk to an analyst about the scope you need.
Can I get an invoice or pay against a purchase order?
Write to sales@dcmarketinsights.com and our team will help.